East Bay Housing Market Deep Dives | September 2026
Newsletter

Newsletter
Single-family prices hold their ground as the condo market splits in two
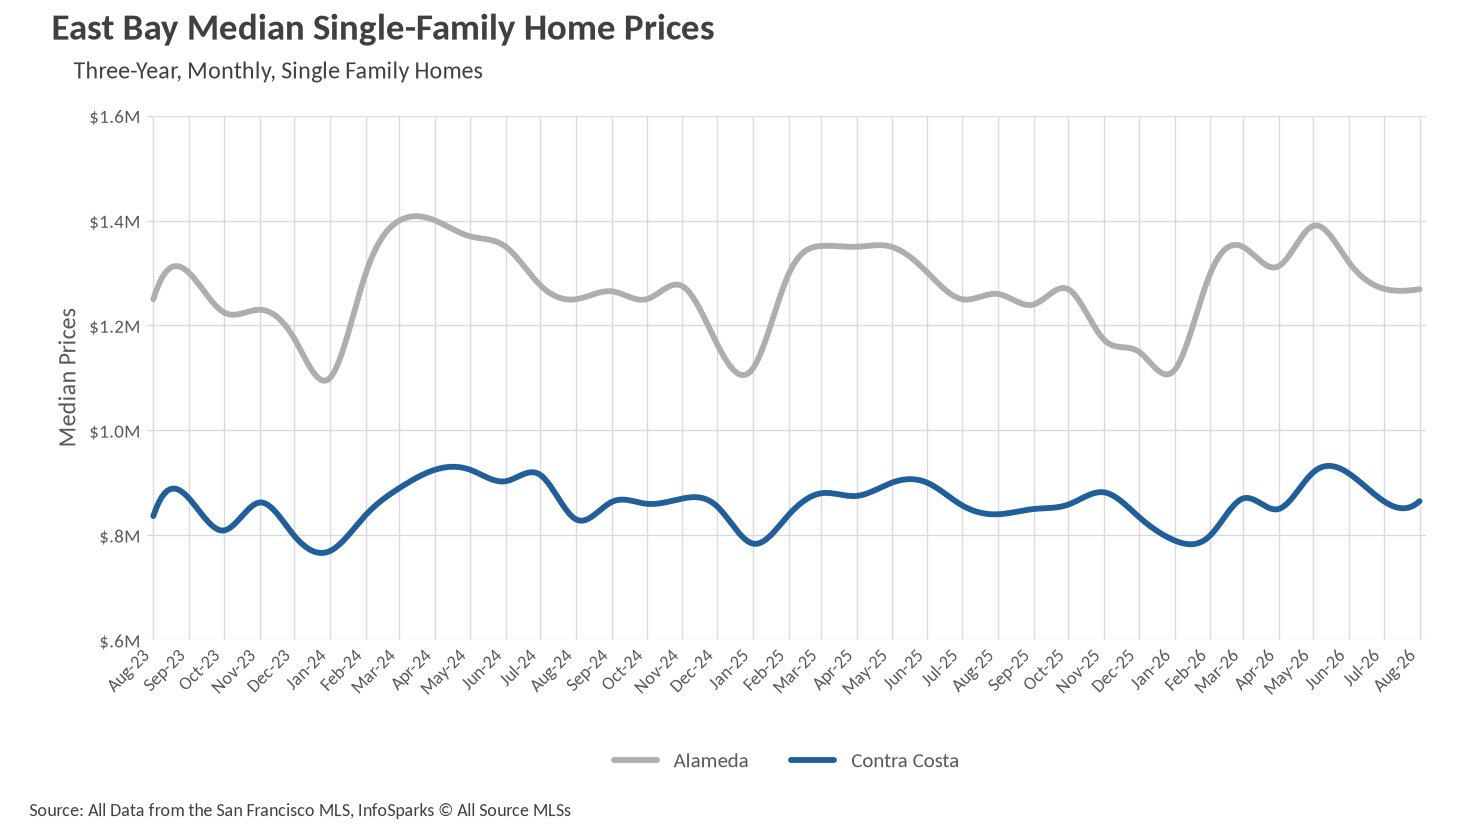
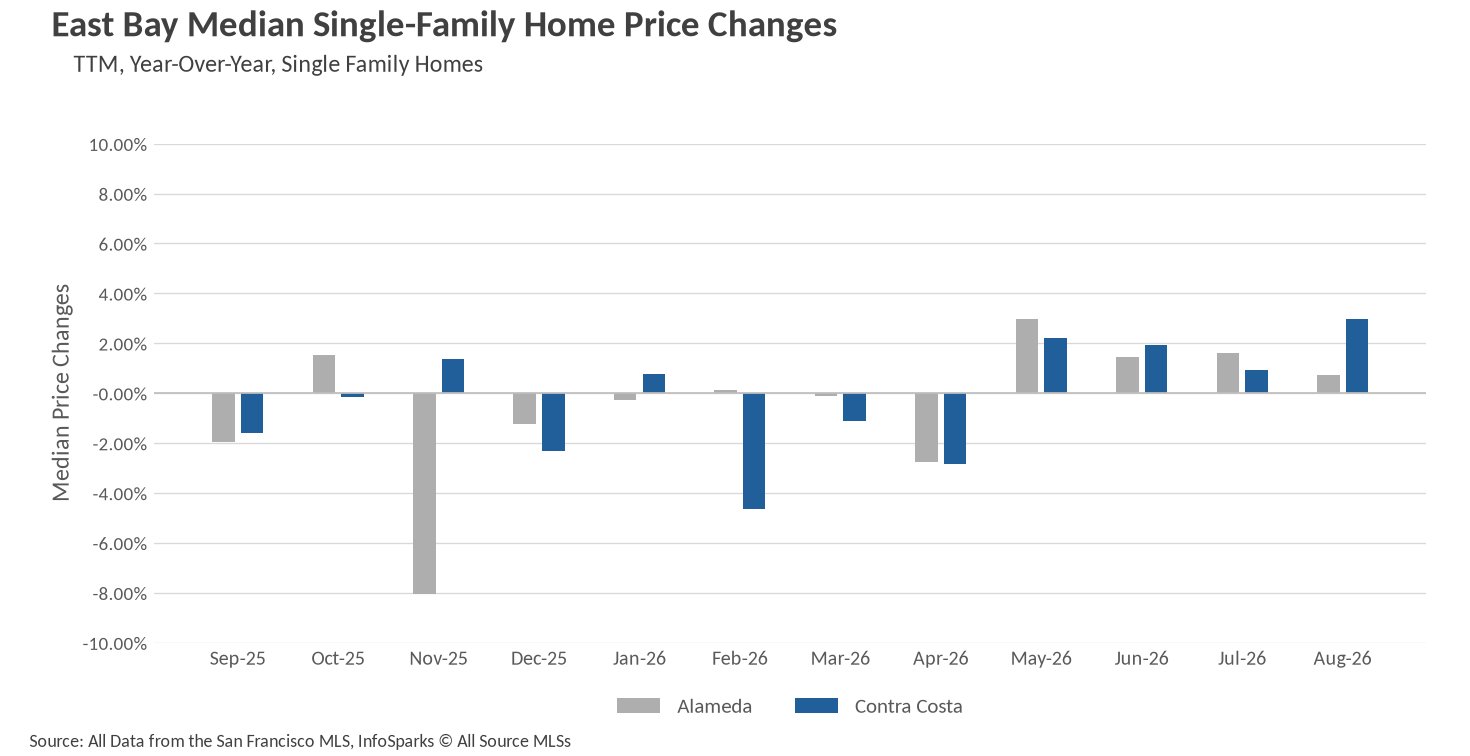
August brought a steady, if quieter, close to the East Bay's summer selling season on the single-family side. In Alameda County, the median single-family home sold for $1,269,000... up 0.71% from last August and essentially unchanged from July's $1,270,000. That puts Alameda roughly $121,000 below the May peak of $1,390,000... which is exactly the kind of seasonal fade you'd expect as the calendar turns toward fall. Contra Costa County looked a bit stronger on a year-over-year basis, with the median coming in at $865,000... a 2.98% gain over last August and flat against July. Both counties are holding their ground in a meaningful way heading into fall.
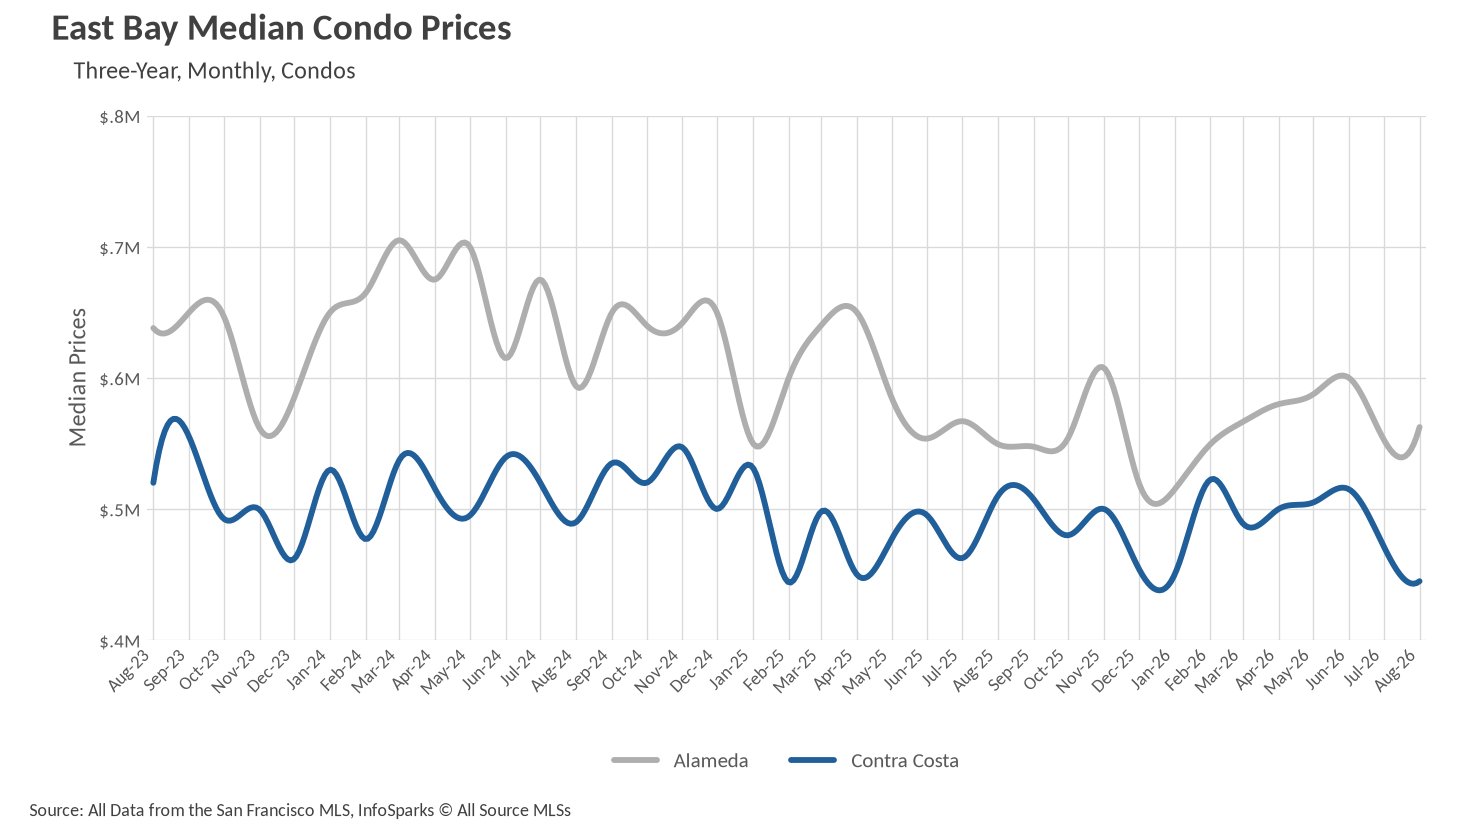
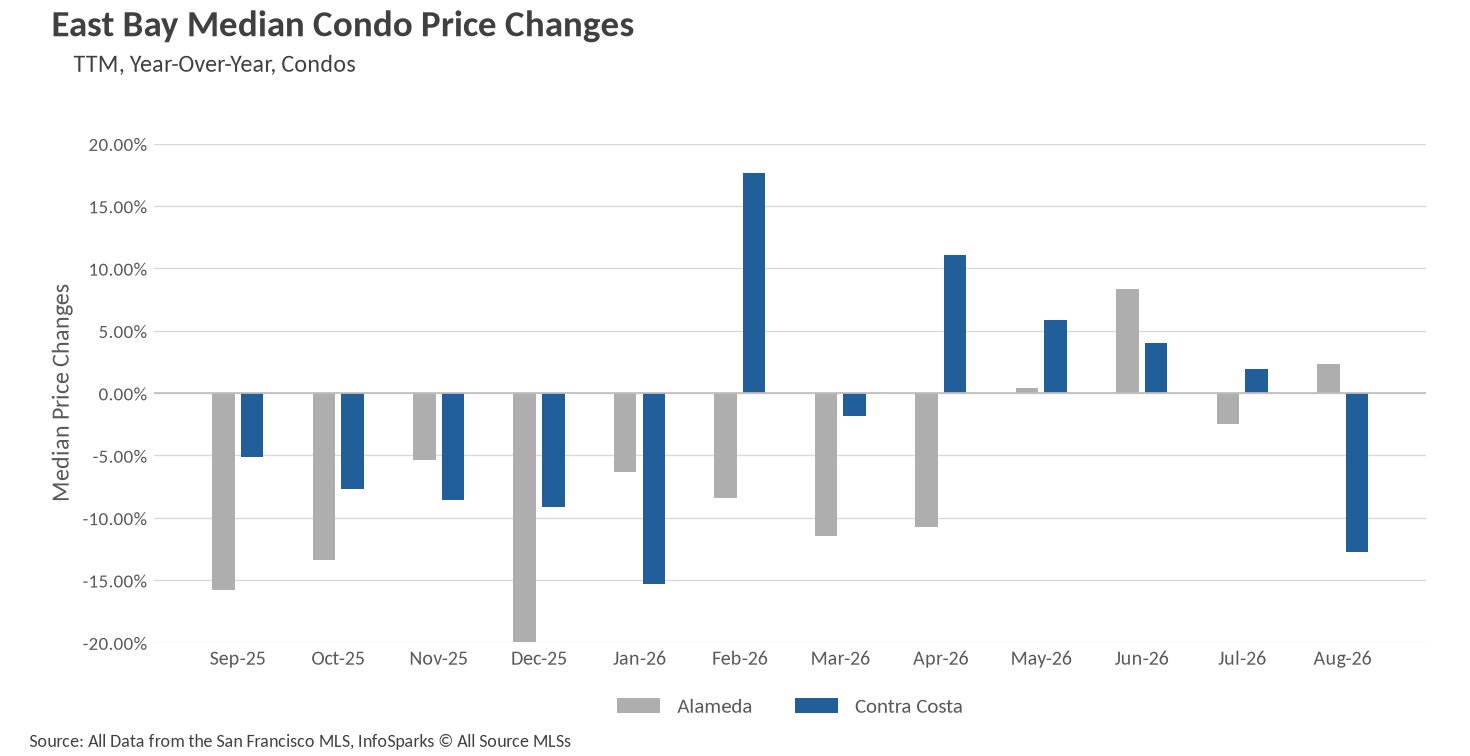
The condo market is where the two counties have gone their separate ways this month. Alameda County condos posted a median of $562,500... up 2.37% year-over-year and up 1.72% from July, continuing a slow but steady recovery off the $515,000 January low. Contra Costa County condos told a very different story, with the median coming in at $444,950... down 12.75% from last August's $510,000 and off 5.63% from July. That's the softest reading we've seen in Contra Costa's condo segment since early 2025, and it's worth watching closely over the next couple of months to determine whether this is a thin-month anomaly or the beginning of a more sustained softening trend.
Inventory keeps shrinking as the summer listing window closes
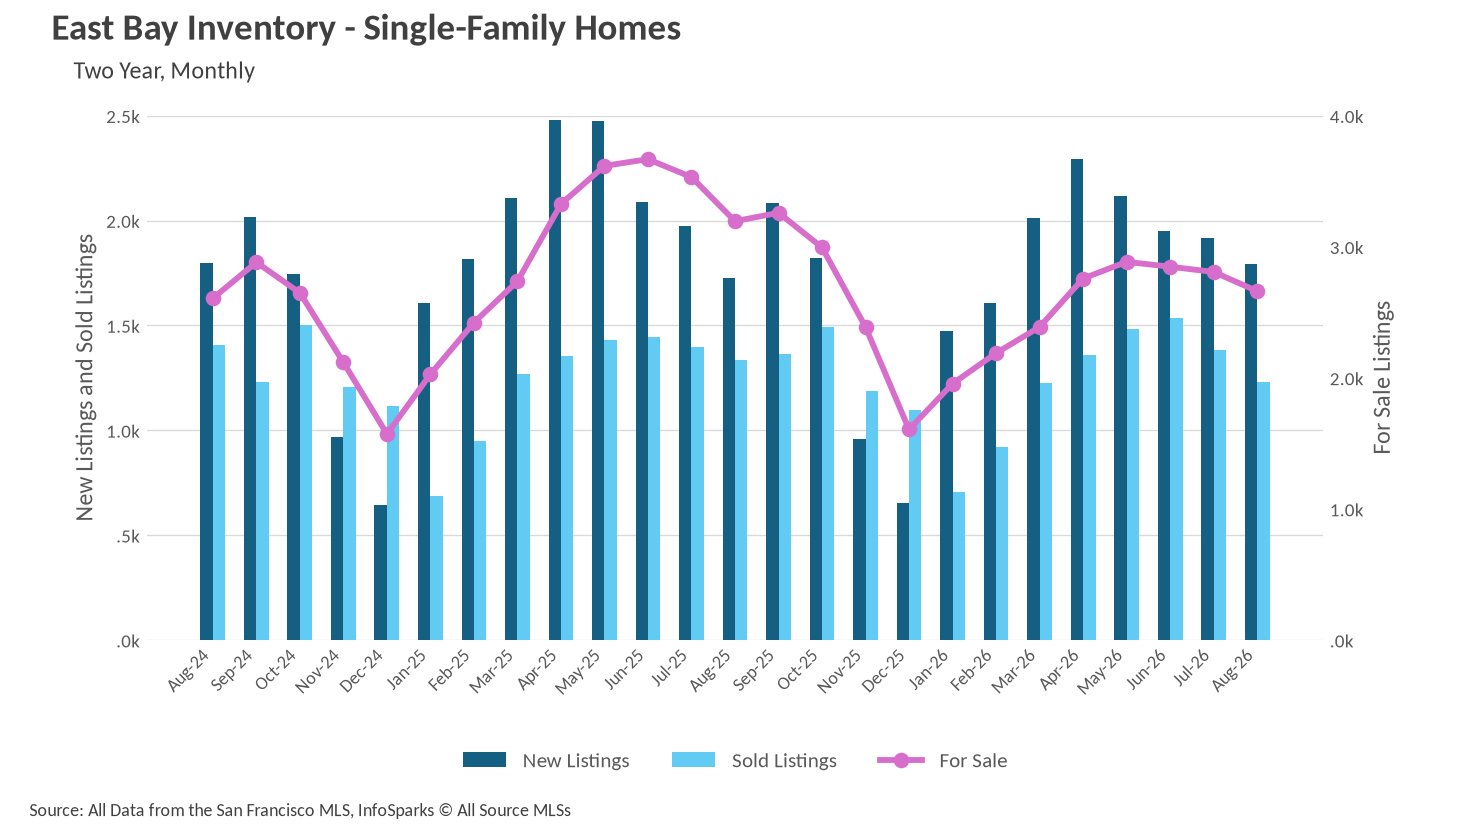
Supply continues to be the defining story of the East Bay market... and it's not letting up. Single-family homes for sale stood at 2,662 units in August... down 16.68% from the 3,195 available a year ago and off 5.20% from July's 2,808. What makes this decline particularly notable is that it's not coming from a lack of sellers. New single-family listings actually rose 3.76% year-over-year to 1,792... but with 1,230 homes selling during the month, the available pool kept draining faster than it could be replenished. Demand is doing the work of tightening supply.
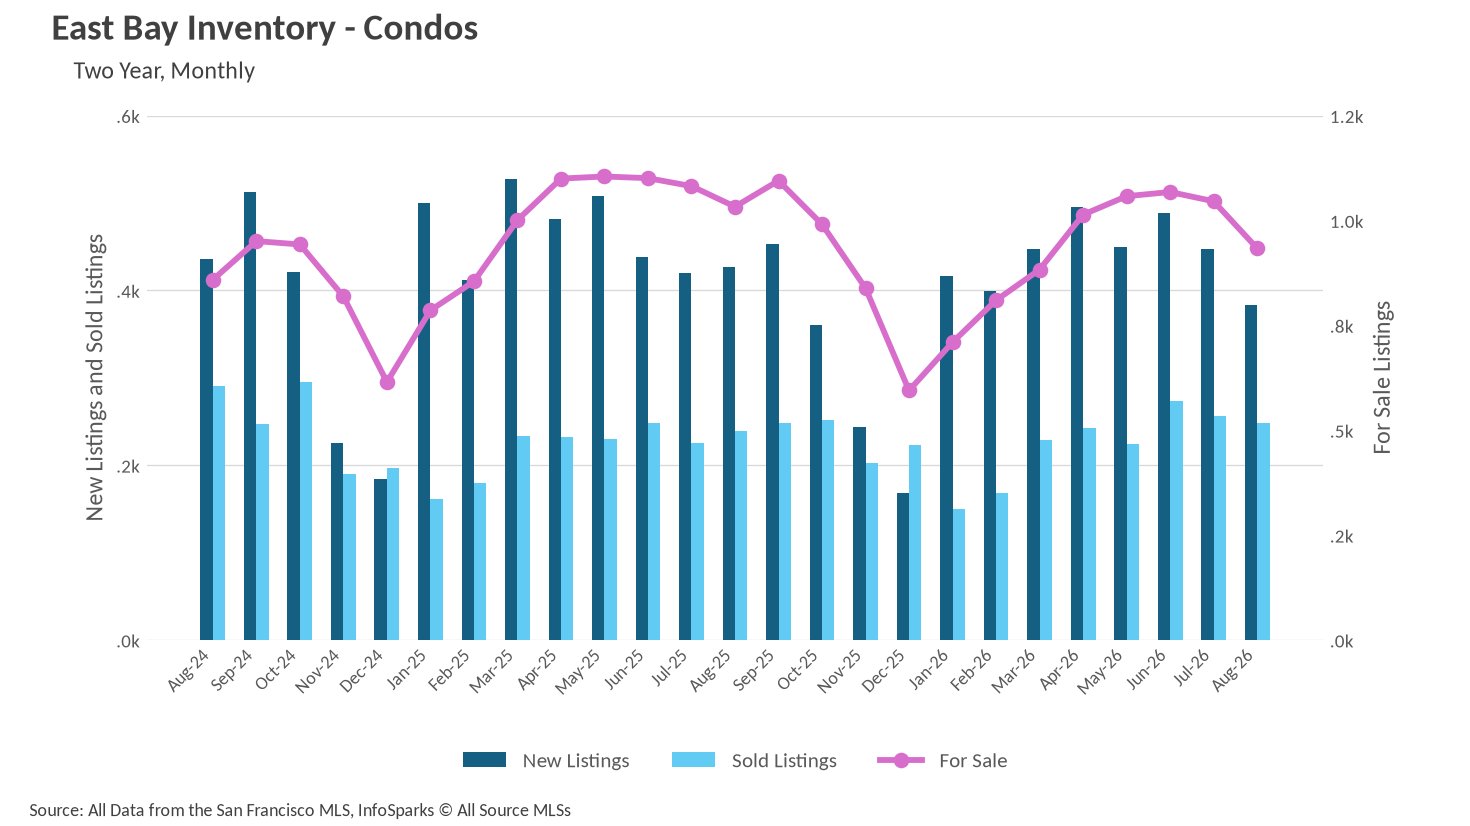
The condo side followed a similar path, though for different reasons. For-sale condo inventory finished August at 934 units... a 9.58% decline year-over-year and a sharp 10.71% drop from July's 1,046. Unlike single-family homes, condo sellers actually pulled back, with new listings falling 10.31% from last August. Condo sales, meanwhile, edged up 3.77% year-over-year to 248 closings. The East Bay is heading into fall with a thinner set of choices than it had a year ago across both property types... which should continue to provide a meaningful floor under pricing even as seasonal demand softens.
Single-family homes still outpacing last year, condos more mixed
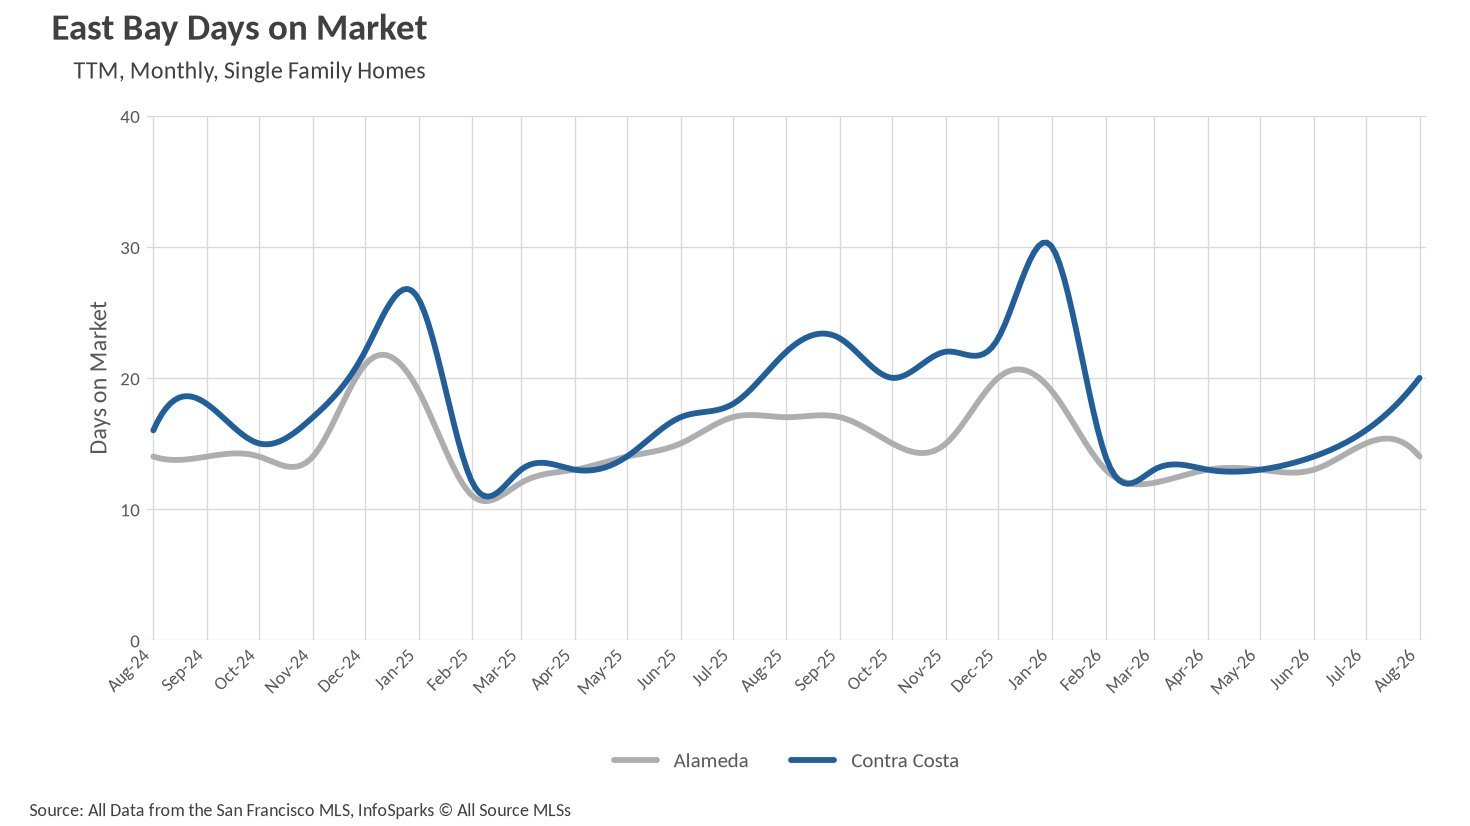
Tight supply continues to translate into quick sales on the single-family side. The average Alameda County single-family home sold in just 14 days in August... a 17.65% improvement over the 17 days it took last August, and a touch faster than July's 15 days. Contra Costa County single-family homes averaged 20 days... a 9.09% improvement year-over-year, though a noticeable step back from 16 days in July and the 13-day pace back in May. That kind of late-summer cooling is completely normal and shouldn't be read as a change in direction... it's the market finding its seasonal rhythm heading into fall.
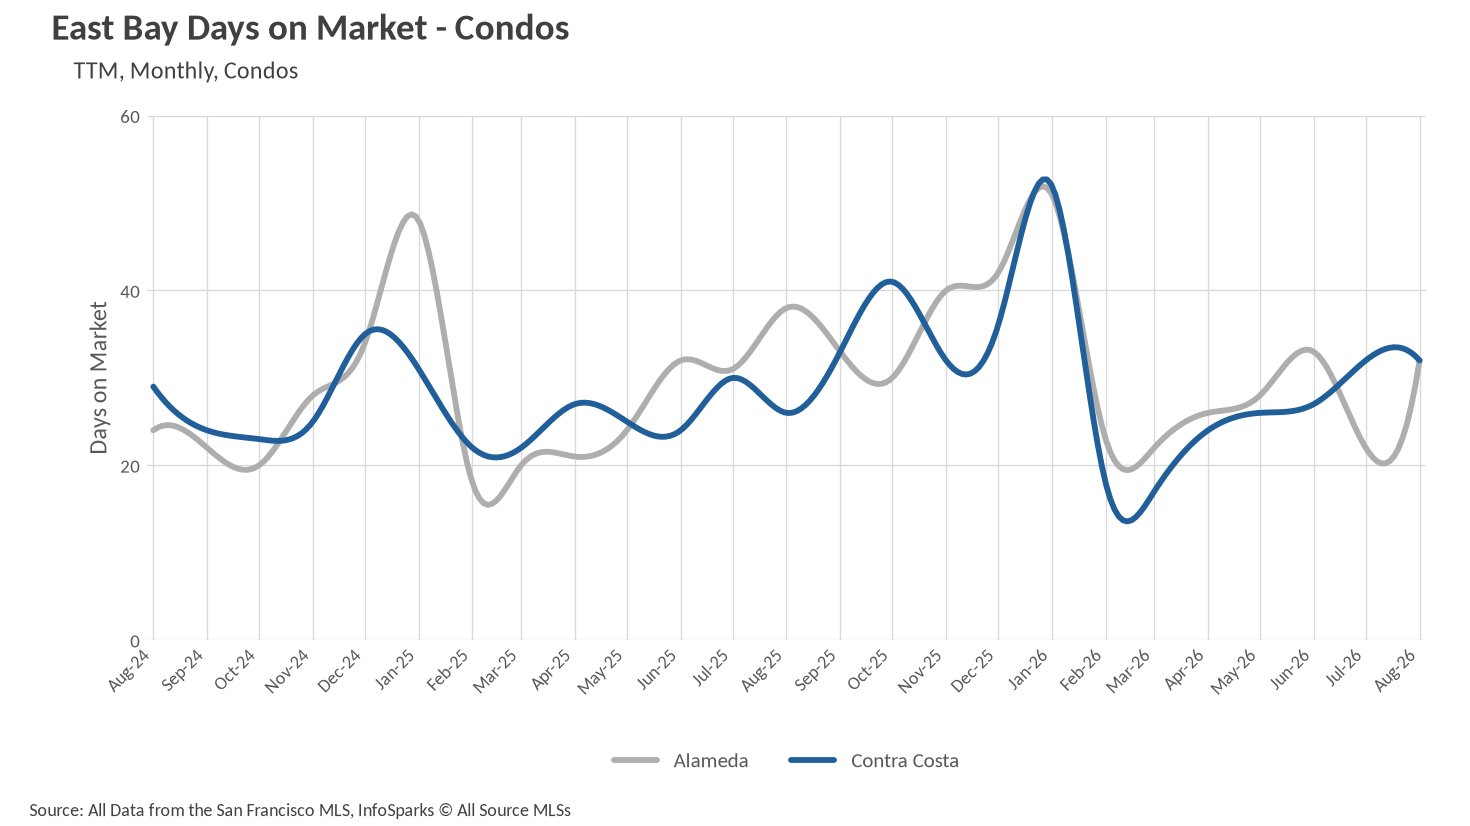
The condo side is where things are more nuanced. Alameda County condos averaged 32 days on market... a 15.79% improvement over the 38 days recorded last August, though up meaningfully from an unusually brisk 22 days in July. Contra Costa County condos also averaged 32 days... matching July but running 23.08% longer than the 26 days it took a year ago. When you pair that with the softer median price we saw in Contra Costa condos this month, it paints a consistent picture of where the current softness in this market is concentrated... and it's squarely in the Contra Costa condo segment right now.
Single-family homes stay a seller's market while condos favor buyers
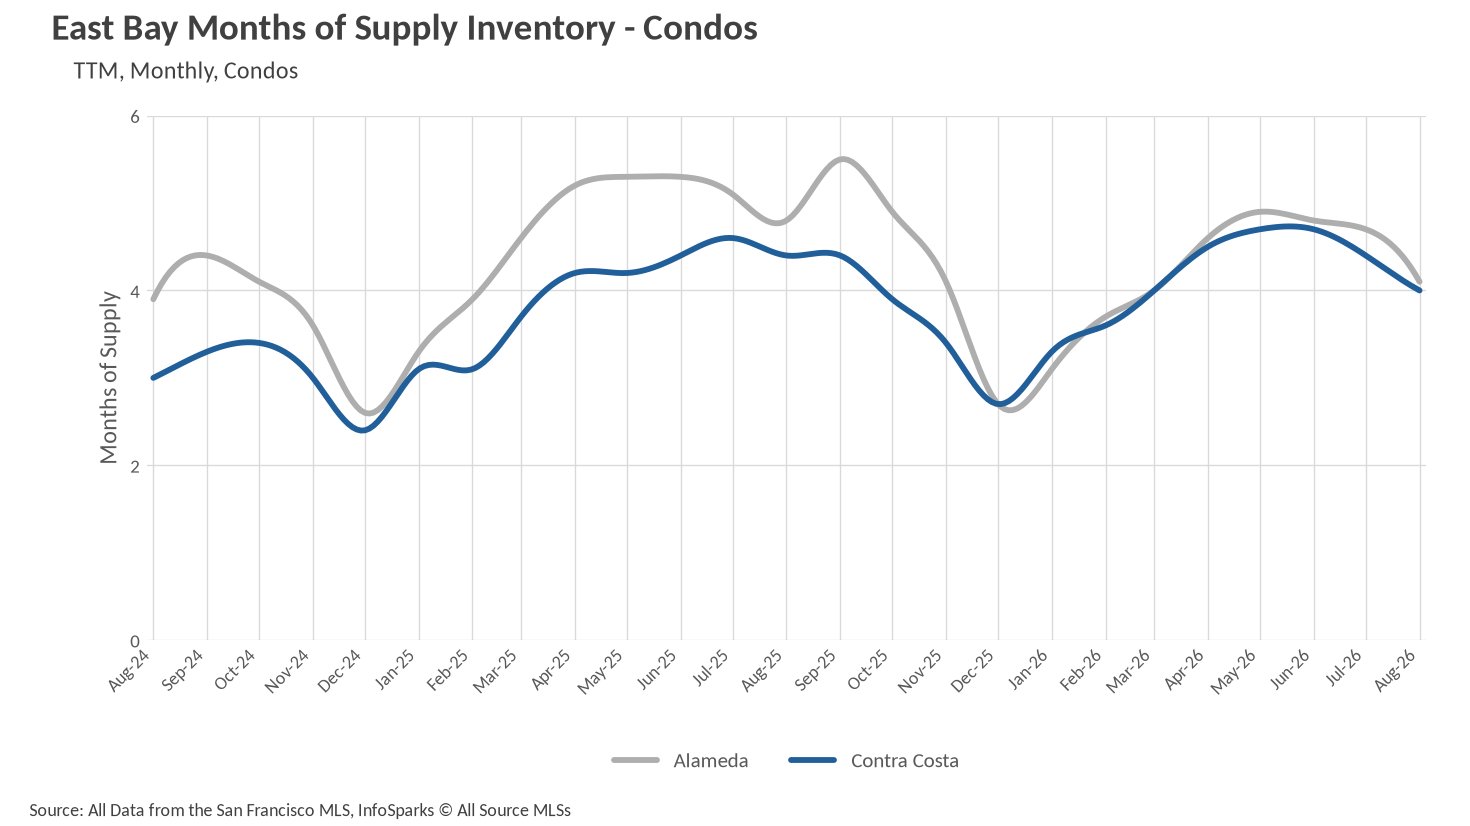
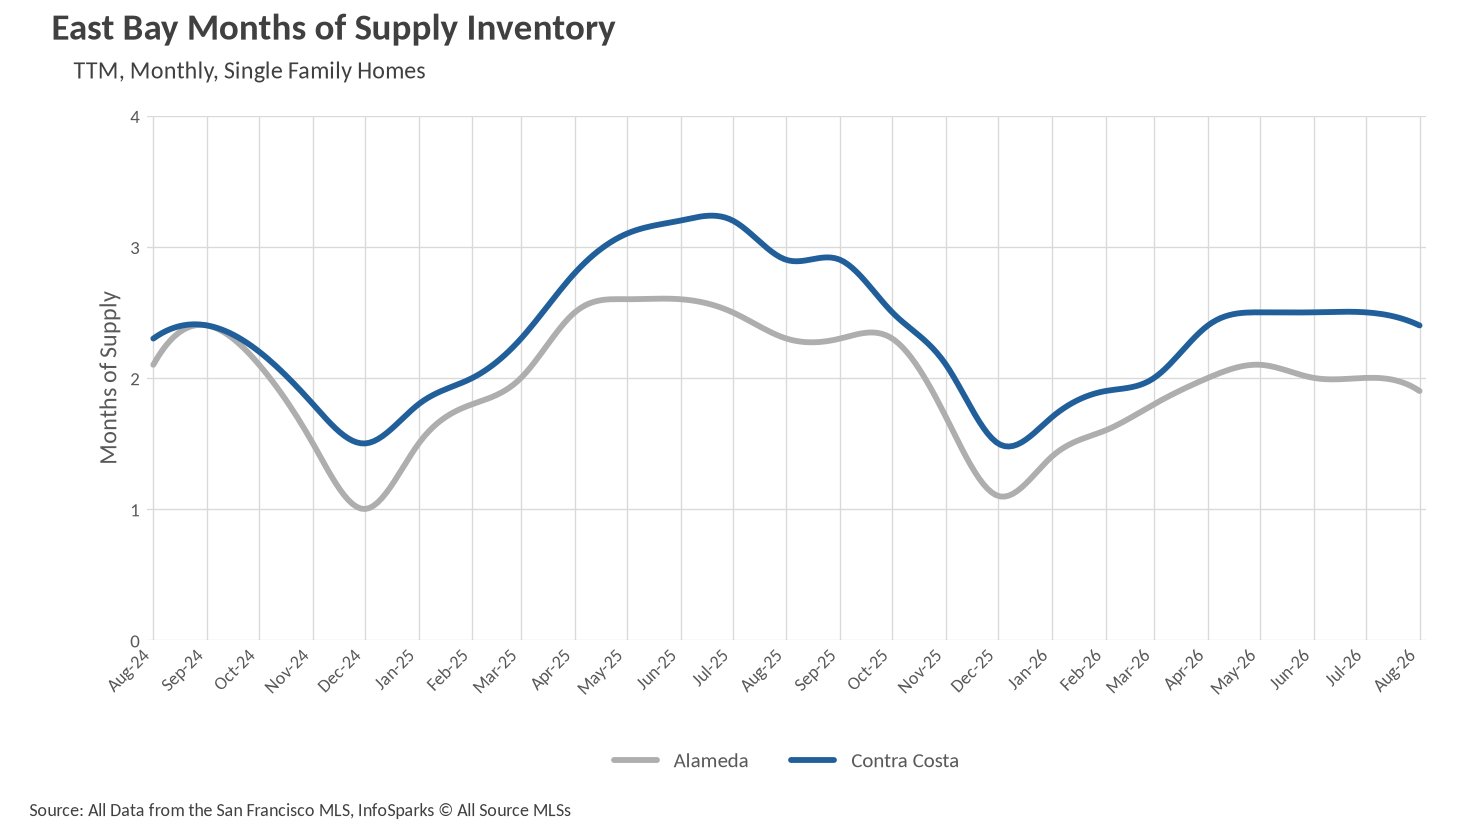
One of the clearest ways to read a market is through Months of Supply Inventory, or MSI. California historically averages around three months... which is considered balanced. Below three months favors sellers. Above three months shifts the advantage toward buyers.
The East Bay's single-family market remains clearly in seller's territory... and conditions are actually tighter than they were this time last year. Alameda County closed August with 1.9 months of supply... down 17.39% from 2.3 months a year ago. Contra Costa County sat at 2.4 months... a 17.24% decline from last August's 2.9 months. Both counties have been trending lower for several consecutive months after peaking in late spring... which means single-family buyers are facing tighter conditions this fall than they did last fall. That's not a small thing... it means the competitive environment for detached homes is intensifying, not easing, as we head into the cooler months.
The condo market continues to sit on the other side of the ledger. Alameda County is at 4.1 months of supply and Contra Costa at 4.0 months... both still in buyer's market territory, and both improved from last August's 4.8 and 4.4 months respectively. Both have also come down from spring highs near 4.9 and 4.7 months... so the condo segment is tightening, even as it remains a genuine buyer's market for now. For condo sellers... particularly in Contra Costa County where pricing has softened... discipline on price and patience with the process remain essential. For condo buyers, this is still the corner of the East Bay market where real negotiating leverage exists... but like everything else in this market, that advantage is gradually narrowing.
Bottom Line
The East Bay is closing out summer in a position that looks a lot like what we've seen all year... single-family homes firmly in seller's territory with inventory running well below last year's levels, and the condo market still offering buyers more room to breathe, even as that room slowly shrinks. Alameda County is the steadier of the two counties right now... with modest single-family price gains, improving condo values, and consistent sales pace on both sides. Contra Costa County is worth watching more closely, particularly in the condo segment where both price and days on market are moving in a direction that favors patient, well-prepared buyers. Heading into fall, the East Bay remains a market that rewards knowing exactly where you stand... because the experience of a single-family buyer and a condo buyer, or an Alameda buyer and a Contra Costa buyer, can feel like entirely different markets depending on where you're looking.
Stay up to date on the latest real estate trends.

Newsletter

Newsletter
A Smart, Stress-Free Plan

Newsletter

Newsletter

Newsletter

Newsletter

Newsletter
Newsletter

Newsletter
You’ve got questions and we can’t wait to answer them.