San Francisco Housing Market Deep Dives | November 2026

San Francisco

San Francisco Housing Market Deep Dives, November 2026, by the Leyla Alhosseini team.

The short version: Prices are up, inventory is down, and homes are flying off the market. Sellers are firmly in control heading into the end of the year.

💰 Prices Bounce Back (Big Time)

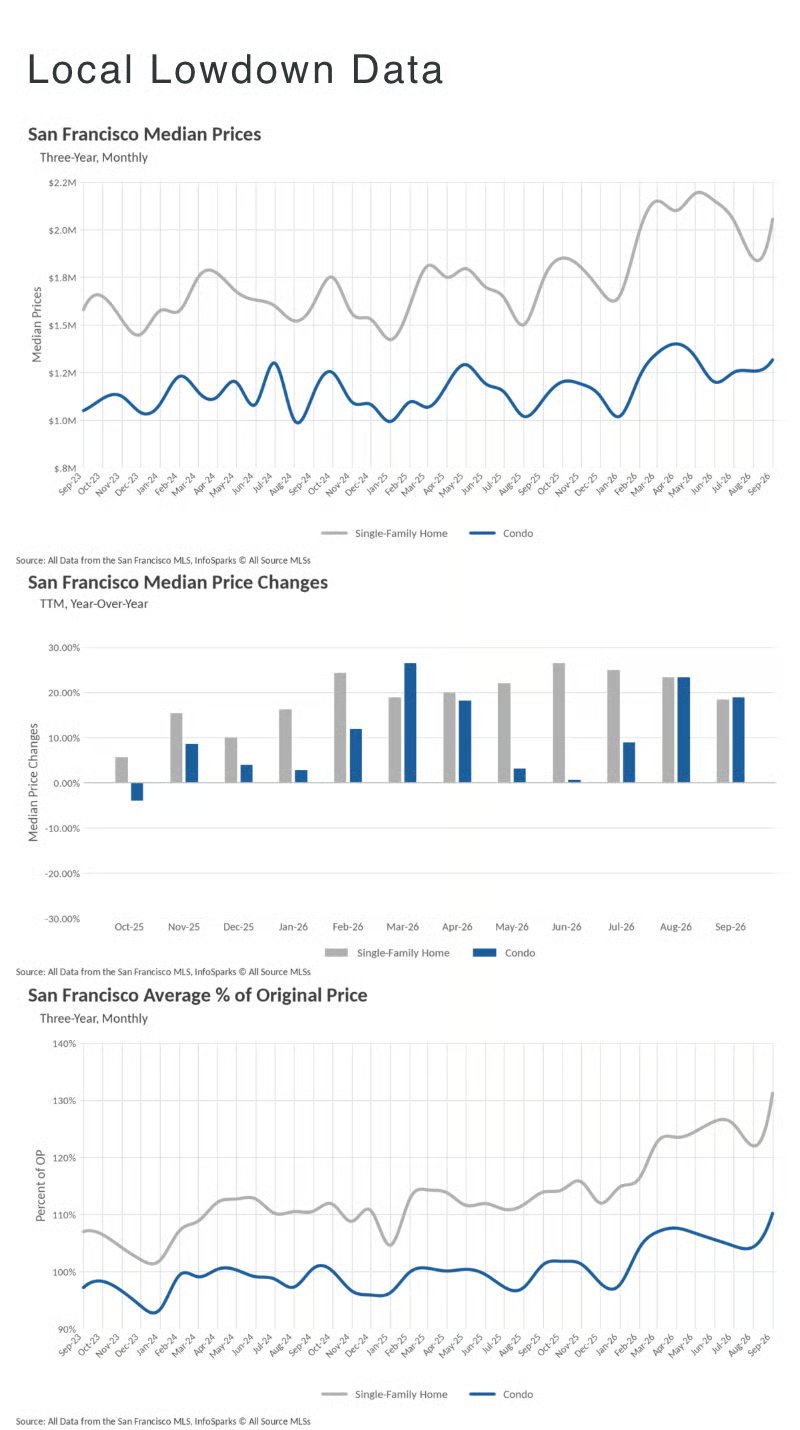
  • Single-family homes are back above $2M. The median sale price hit $2,054,000, up 11% from August and 18.4% from last September’s $1,735,000.
  • August’s dip was short-lived. The median briefly fell to $1,850,000 in August, but September erased that drop in a single month.
  • Condos are climbing too. The median condo price reached $1,316,500, up 18.9% year-over-year and 4.7% from August. That’s three straight months of gains.

🔥 Buyers Are Paying Way Over Asking

  • Single-family homes sold for 31% over asking on average. That’s a record high for this three-year data set, more than double last year’s 14%.
  • Condos sold for 10% over asking. Also a record, and a huge jump from just 1% last September.
  • What this means: Competition isn’t just holding steady, it’s heating up.

🏠 More Listings, But Still Not Enough

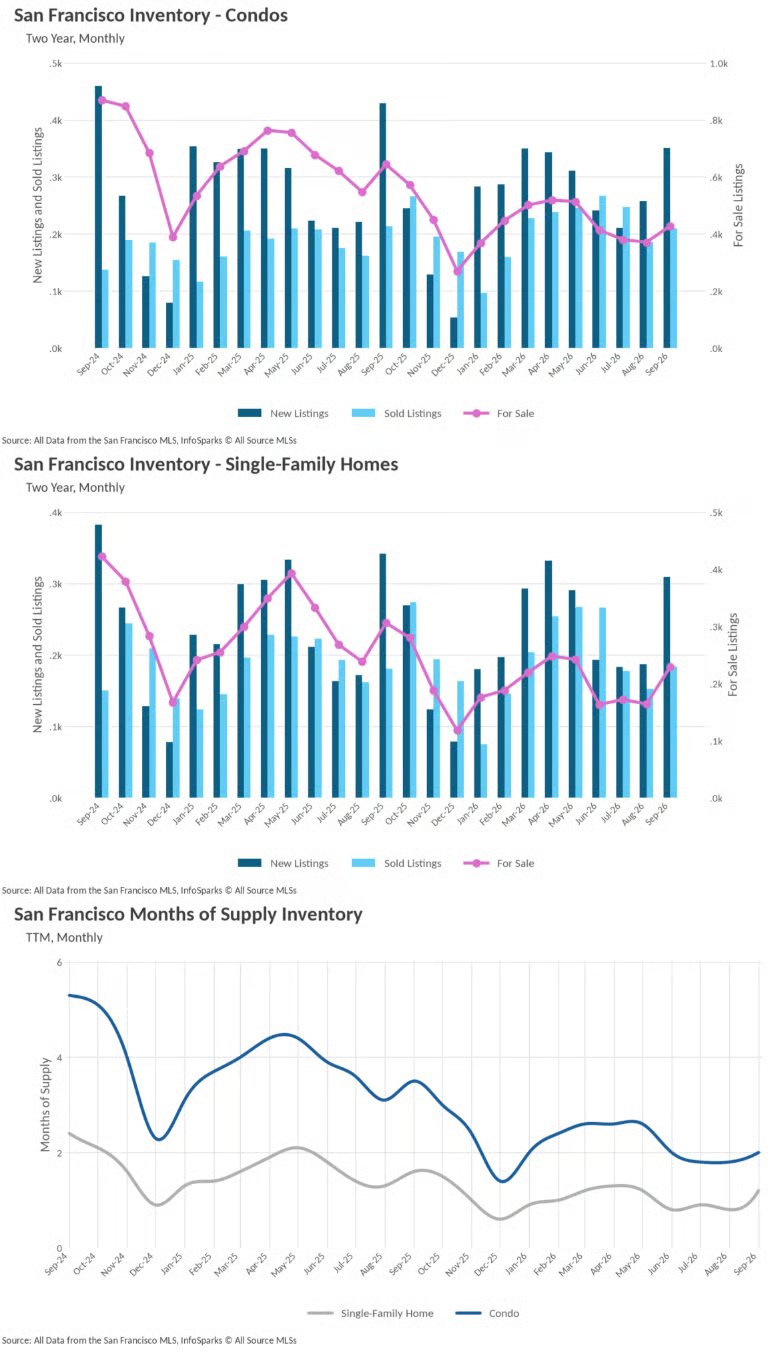
  • Fall inventory finally arrived. There were 229 single-family homes for sale, up nearly 40% from August and the highest count since April.
  • Still well below last year. Single-family inventory is down 25% from September 2025, and condo inventory is down almost 34%.
  • Demand is steady while supply shrinks. Sales held flat year-over-year (184 vs. 181 single-family; 210 vs. 214 condos), but new listings dropped in both categories.
  • Citywide snapshot: About 650 homes were available at the end of September, compared with roughly 950 a year ago.

⚡ Homes Are Selling Fast

  • Single-family homes sell in about 12 days. That pace has held steady at 12 to 13 days every month since February.
  • Condos have sped up dramatically. They now sell in 14 days on average, down from 26 days last September and 19 days in August.
  • A major shift for condos. Just this past winter, condos were sitting for 49 days (December) and 68 days (January). Now they’re moving nearly as fast as single-family homes.

📊 Is It a Buyer’s or Seller’s Market?

  • How it’s measured: Months of Supply Inventory (MSI) shows how long current inventory would last at today’s sales pace. Around 3 months is balanced, below 3 favors sellers, and above 3 favors buyers.
  • Single-family homes: 1.2 months. Up slightly from August’s 0.8, but still 25% below last year.
  • Condos: 2.0 months. Down from 3.5 months a year ago. Last spring, condos were above 4 months, which was buyer’s territory. That’s flipped completely.

🎯 The Bottom Line

  • Sellers have the upper hand. Record over-asking premiums, two-week sale times, and inventory running 25% to 34% below last year all point the same way.
  • Buyers should come prepared. Expect competition, act quickly, and be ready to pay above list price, especially for single-family homes.

San Francisco housing market charts comparing single-family home and condo prices, price changes, and sale-to-list ratios.

Three charts show San Francisco condo and single-family home inventory trends from September 2024 to September 2026.

Let's Talk

You’ve got questions and we can’t wait to answer them.