East Bay Housing Market Deep Dives | November 2026

Newsletter

East Bay Housing Market Deep Dives, November 2026, by Leyla Alhosseini team

The short version: Prices are holding steady compared to last year, inventory has dropped sharply, and single-family homes are selling faster. Condos are slower but moving toward a more balanced market.

💰 Prices Hold Steady Year-Over-Year

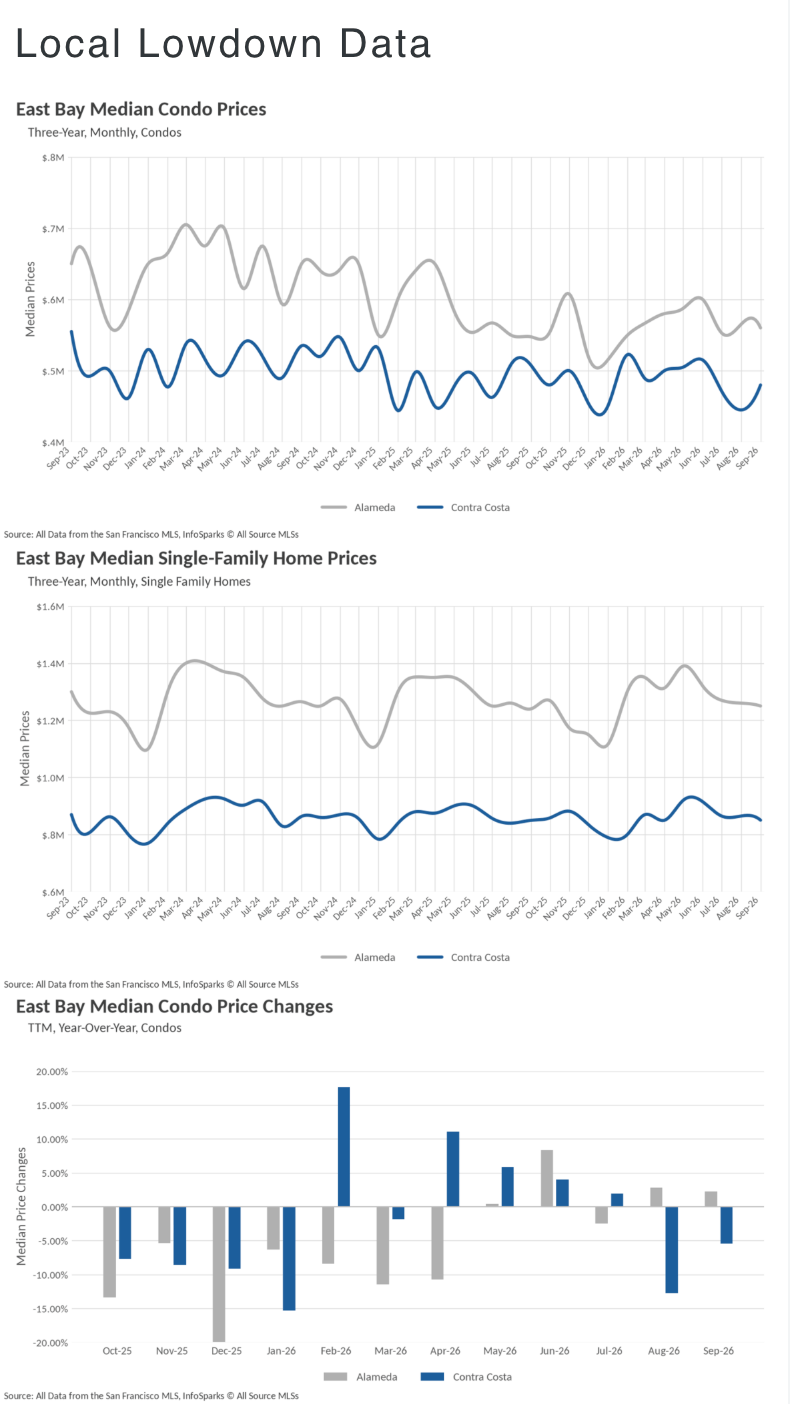
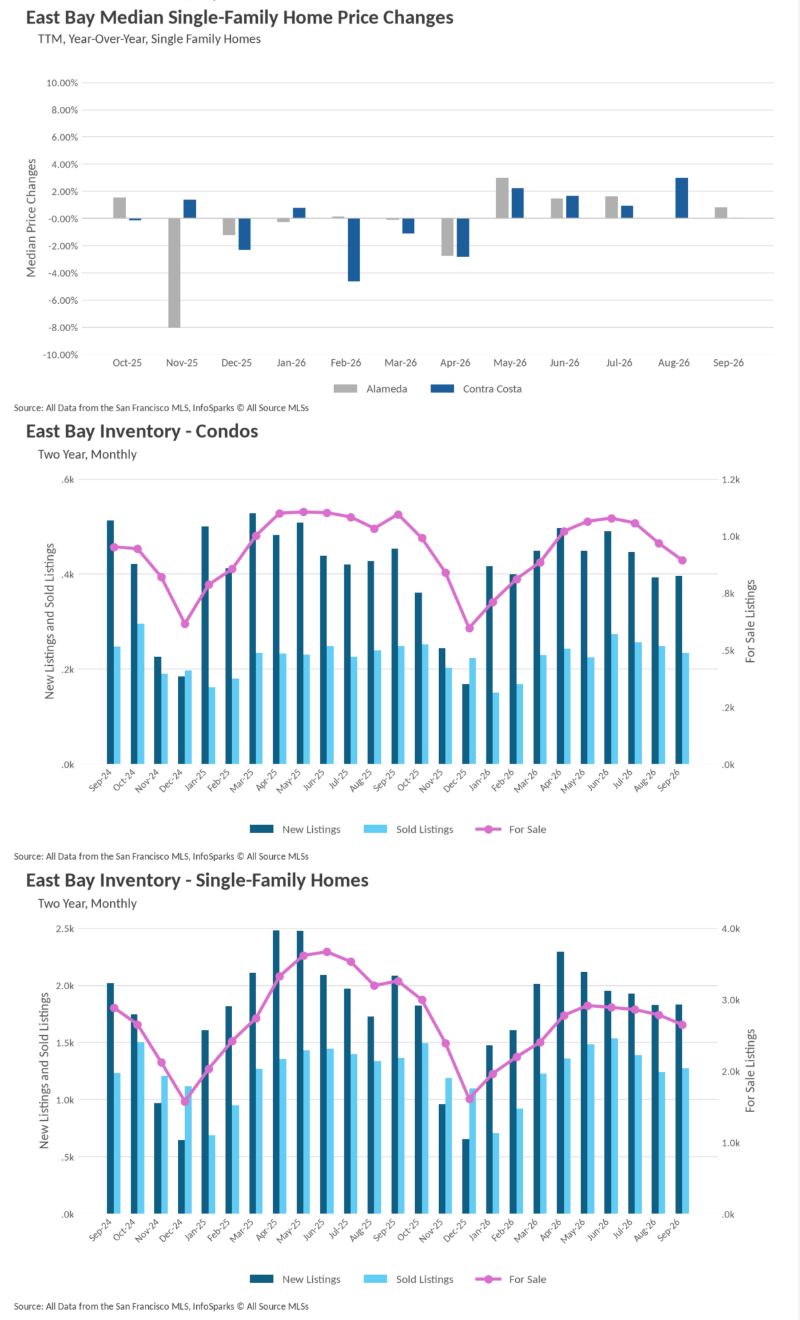
  • Alameda County single-family: $1,250,000. That's up 0.8% from last September and just slightly below August's $1,260,000.
  • Contra Costa County single-family: $850,500. Essentially flat compared to $850,000 a year ago, and down 1.7% from August.
  • A gentle fall cooldown. Alameda prices have eased for four straight months since the May peak of $1,390,000, which is typical seasonal behavior.

🏢 Condos Are a Mixed Bag

  • Alameda County condos are up. The median hit $560,000, a 2.3% gain from last year, holding onto most of the growth since January's low of $515,000.
  • Contra Costa condos are down year-over-year. The median of $480,000 is 5.4% below last September's $507,500.
  • But Contra Costa bounced back this month. Prices jumped 7.9% from August's $444,950, which was the lowest reading of the year.

🏠 Inventory Drops Sharply

  • Single-family listings are down nearly 19%. There were 2,648 homes for sale, compared with 3,259 last September.
  • Condo listings fell by a similar amount. There were 894 condos for sale, down 18.4% from 1,095 a year ago.
  • Fewer sellers are listing. New listings dropped about 12% for both single-family homes and condos.
  • Demand is holding up better than supply. Single-family sales were down only 6.7% and condo sales just 5.7%, so available homes are getting snapped up faster.

⚡ Single-Family Homes Speed Up, Condos Slow Down

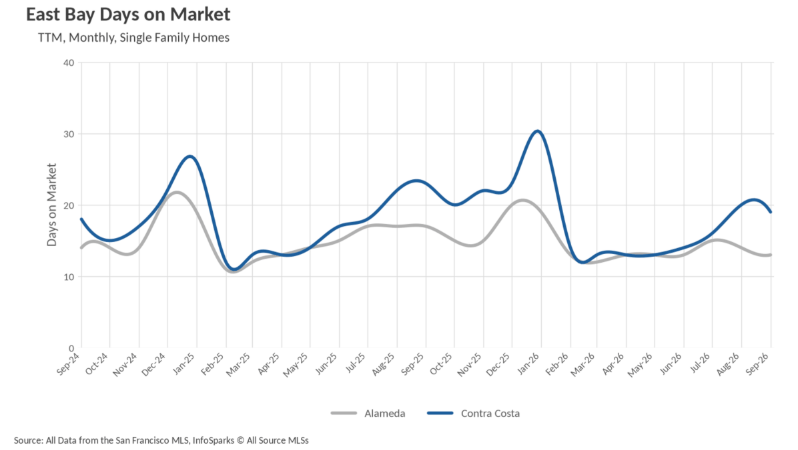
  • Alameda single-family homes sell in 13 days. That's 4 days faster than last September's 17 days.
  • Contra Costa single-family homes sell in 19 days. Faster than last year's 23 days, though creeping up from the 13-day lows this spring.
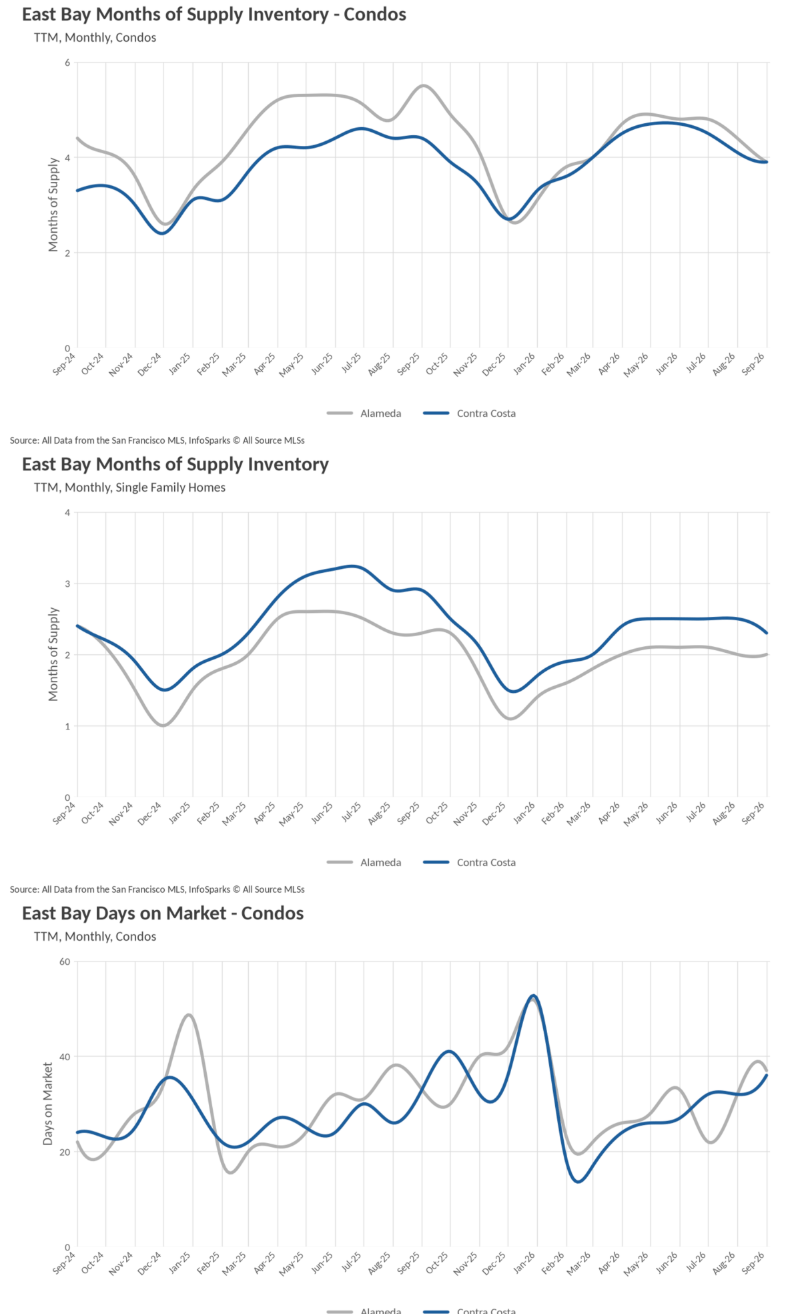
  • Condos are taking longer. Alameda condos averaged 37 days (up from 33) and Contra Costa condos averaged 36 days (also up from 33).
  • Condo buyers have breathing room. Marketing times have been getting longer since summer, giving buyers more time to decide.

📊 Is It a Buyer's or Seller's Market?

  • How it's measured: Months of Supply Inventory (MSI) shows how long current inventory would last at today's sales pace. Around 3 months is balanced, below 3 favors sellers, and above 3 favors buyers.
  • Single-family homes: firmly a seller's market. Alameda sits at 2.0 months (down from 2.3) and Contra Costa at 2.3 months (down from 2.9).
  • Condos: still buyer-leaning, but shifting. Both counties are at 3.9 months, a big improvement from a year ago.
  • Alameda condos have come a long way. Supply has dropped from 5.5 months last September and is approaching balanced territory for the first time in over a year.

🎯 The Bottom Line

  • Single-family sellers are in a strong position. Tight inventory and fast sales mean buyers should be ready to move quickly.
  • Condo buyers still have some leverage. Longer marketing times and higher supply give more room to negotiate, but that window is gradually closing.

East Bay housing market charts comparing Alameda and Contra Costa condo and single-family home prices.

East Bay real estate charts of home price changes and condo and single-family inventory.

Three charts compare Alameda and Contra Costa housing inventory and condo days on market.

East Bay days on market chart comparing Alameda and Contra Costa single-family homes from September 2024 to September 2026.

Let's Talk

You’ve got questions and we can’t wait to answer them.