East Bay Housing Market Trends | May 2026
East Bay

East Bay
Single-family homes hold steady while condos continue to soften
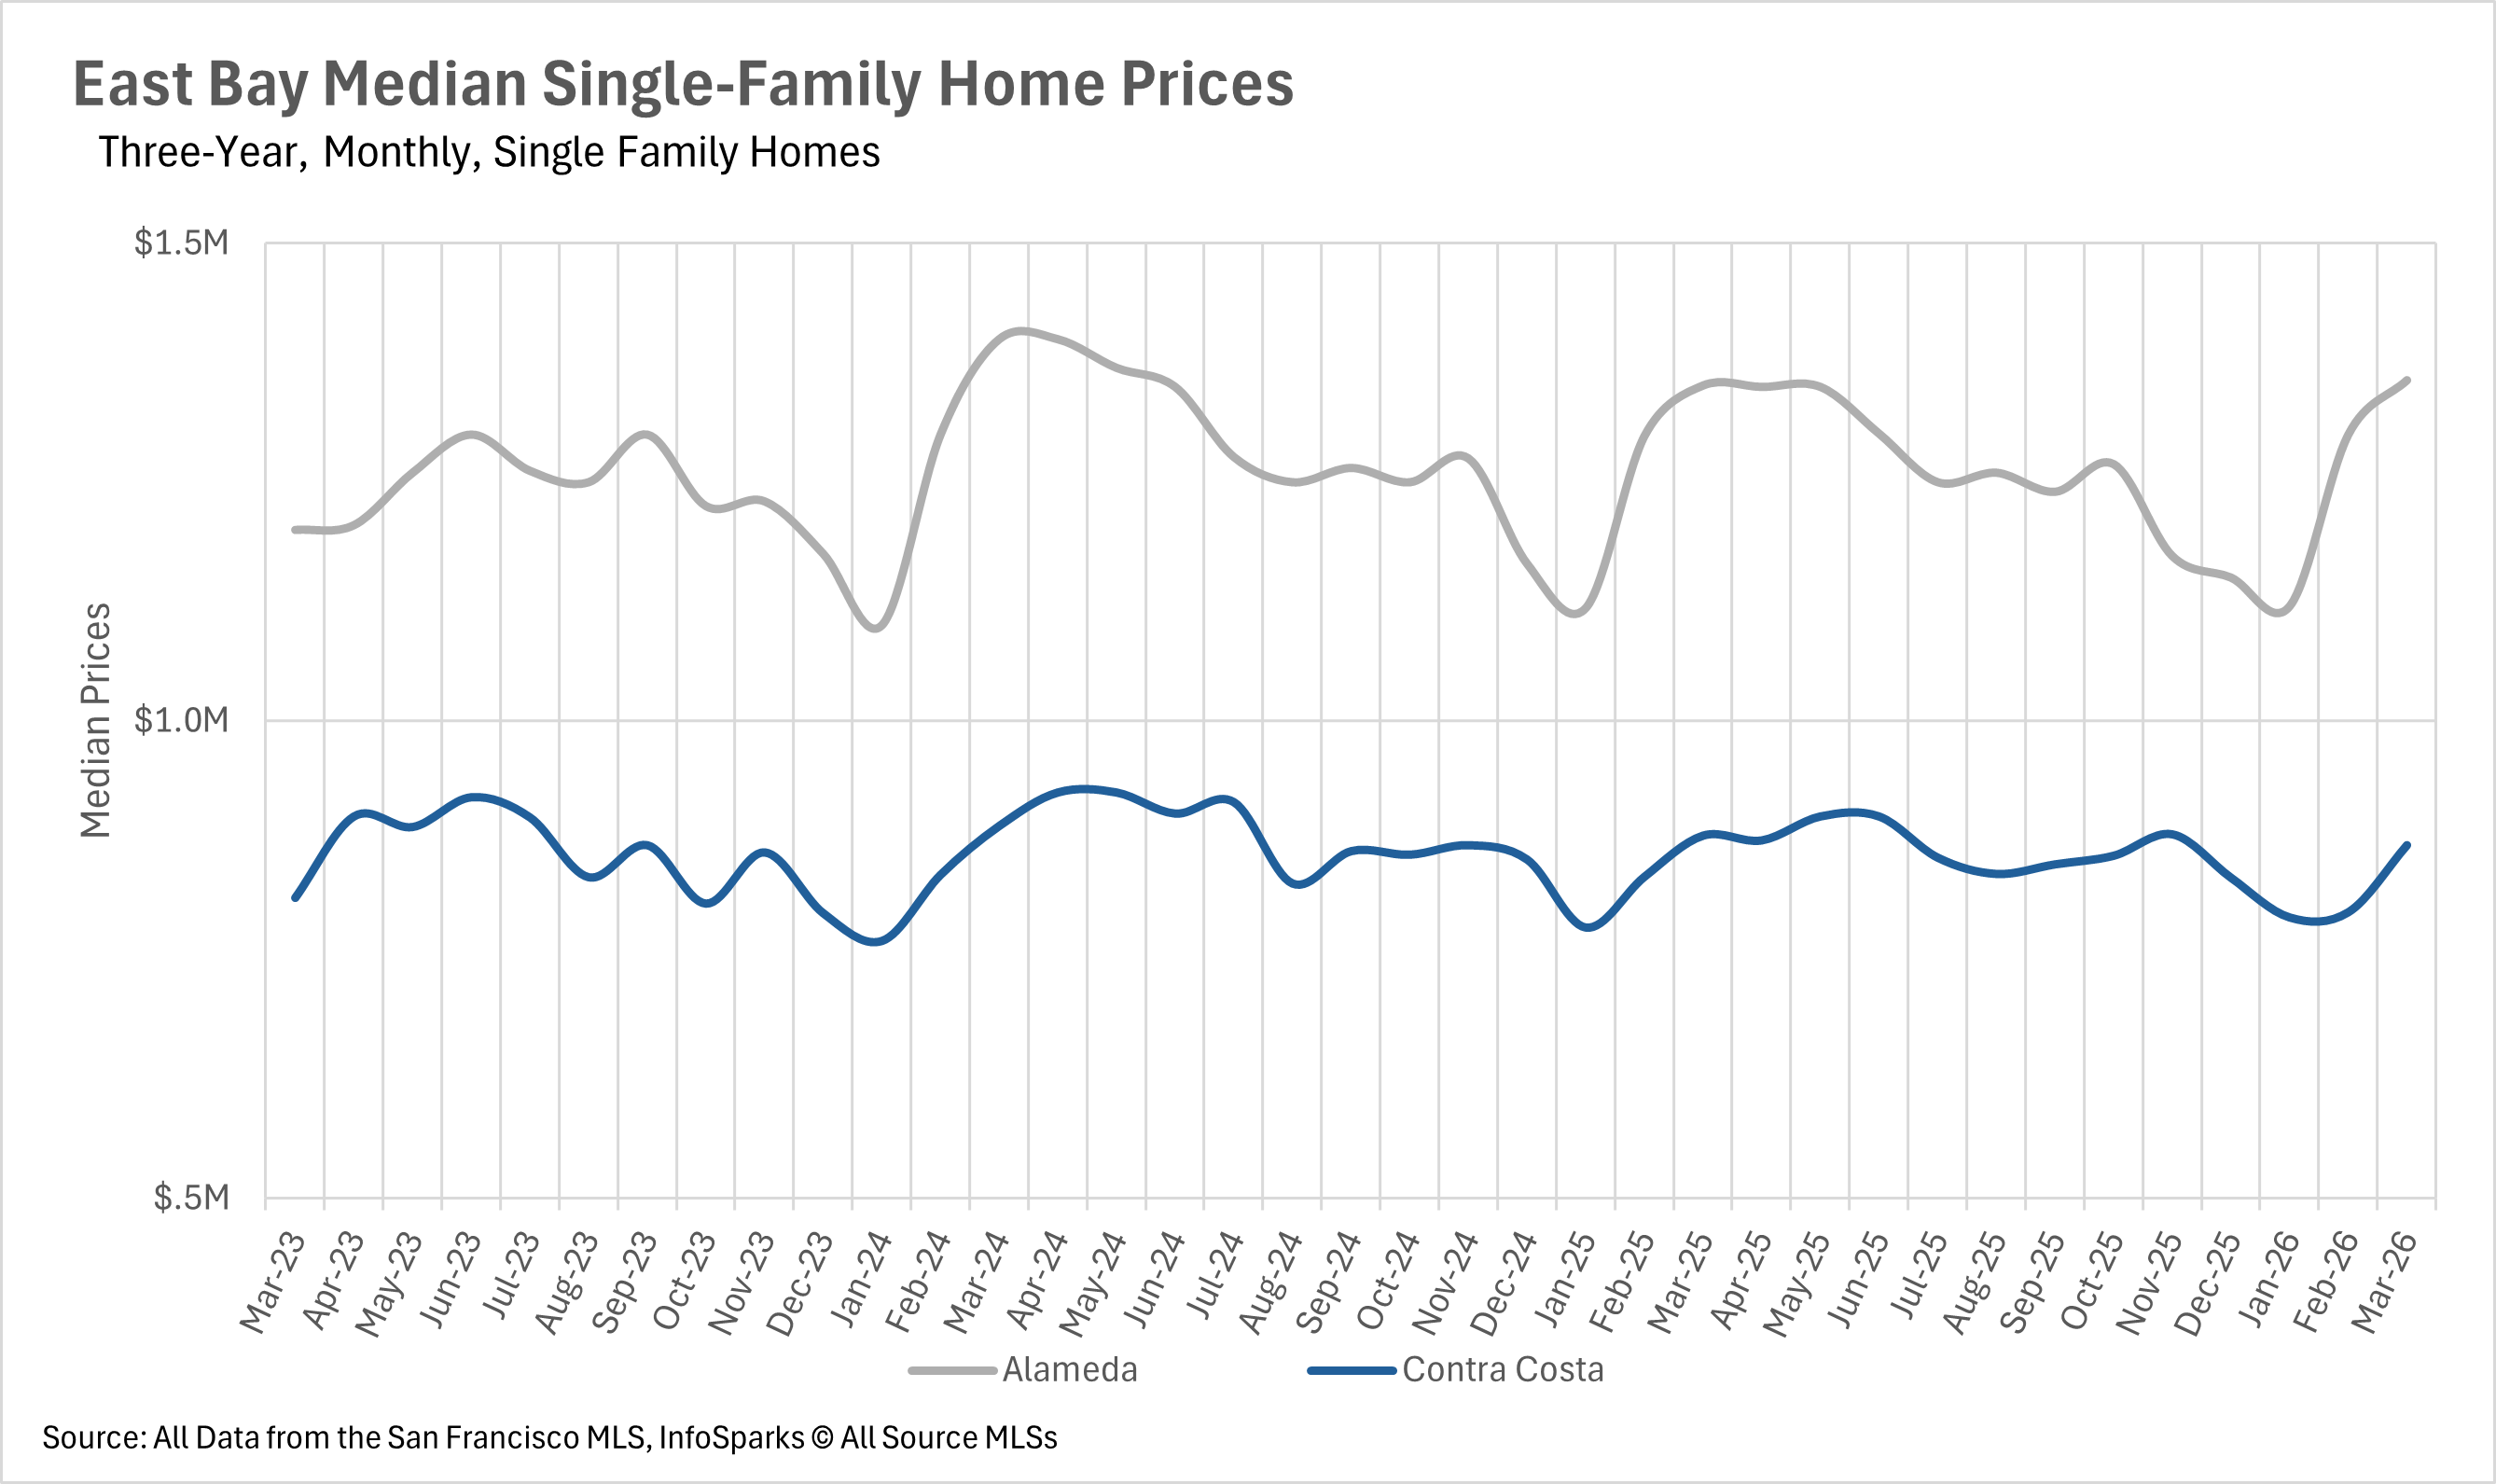
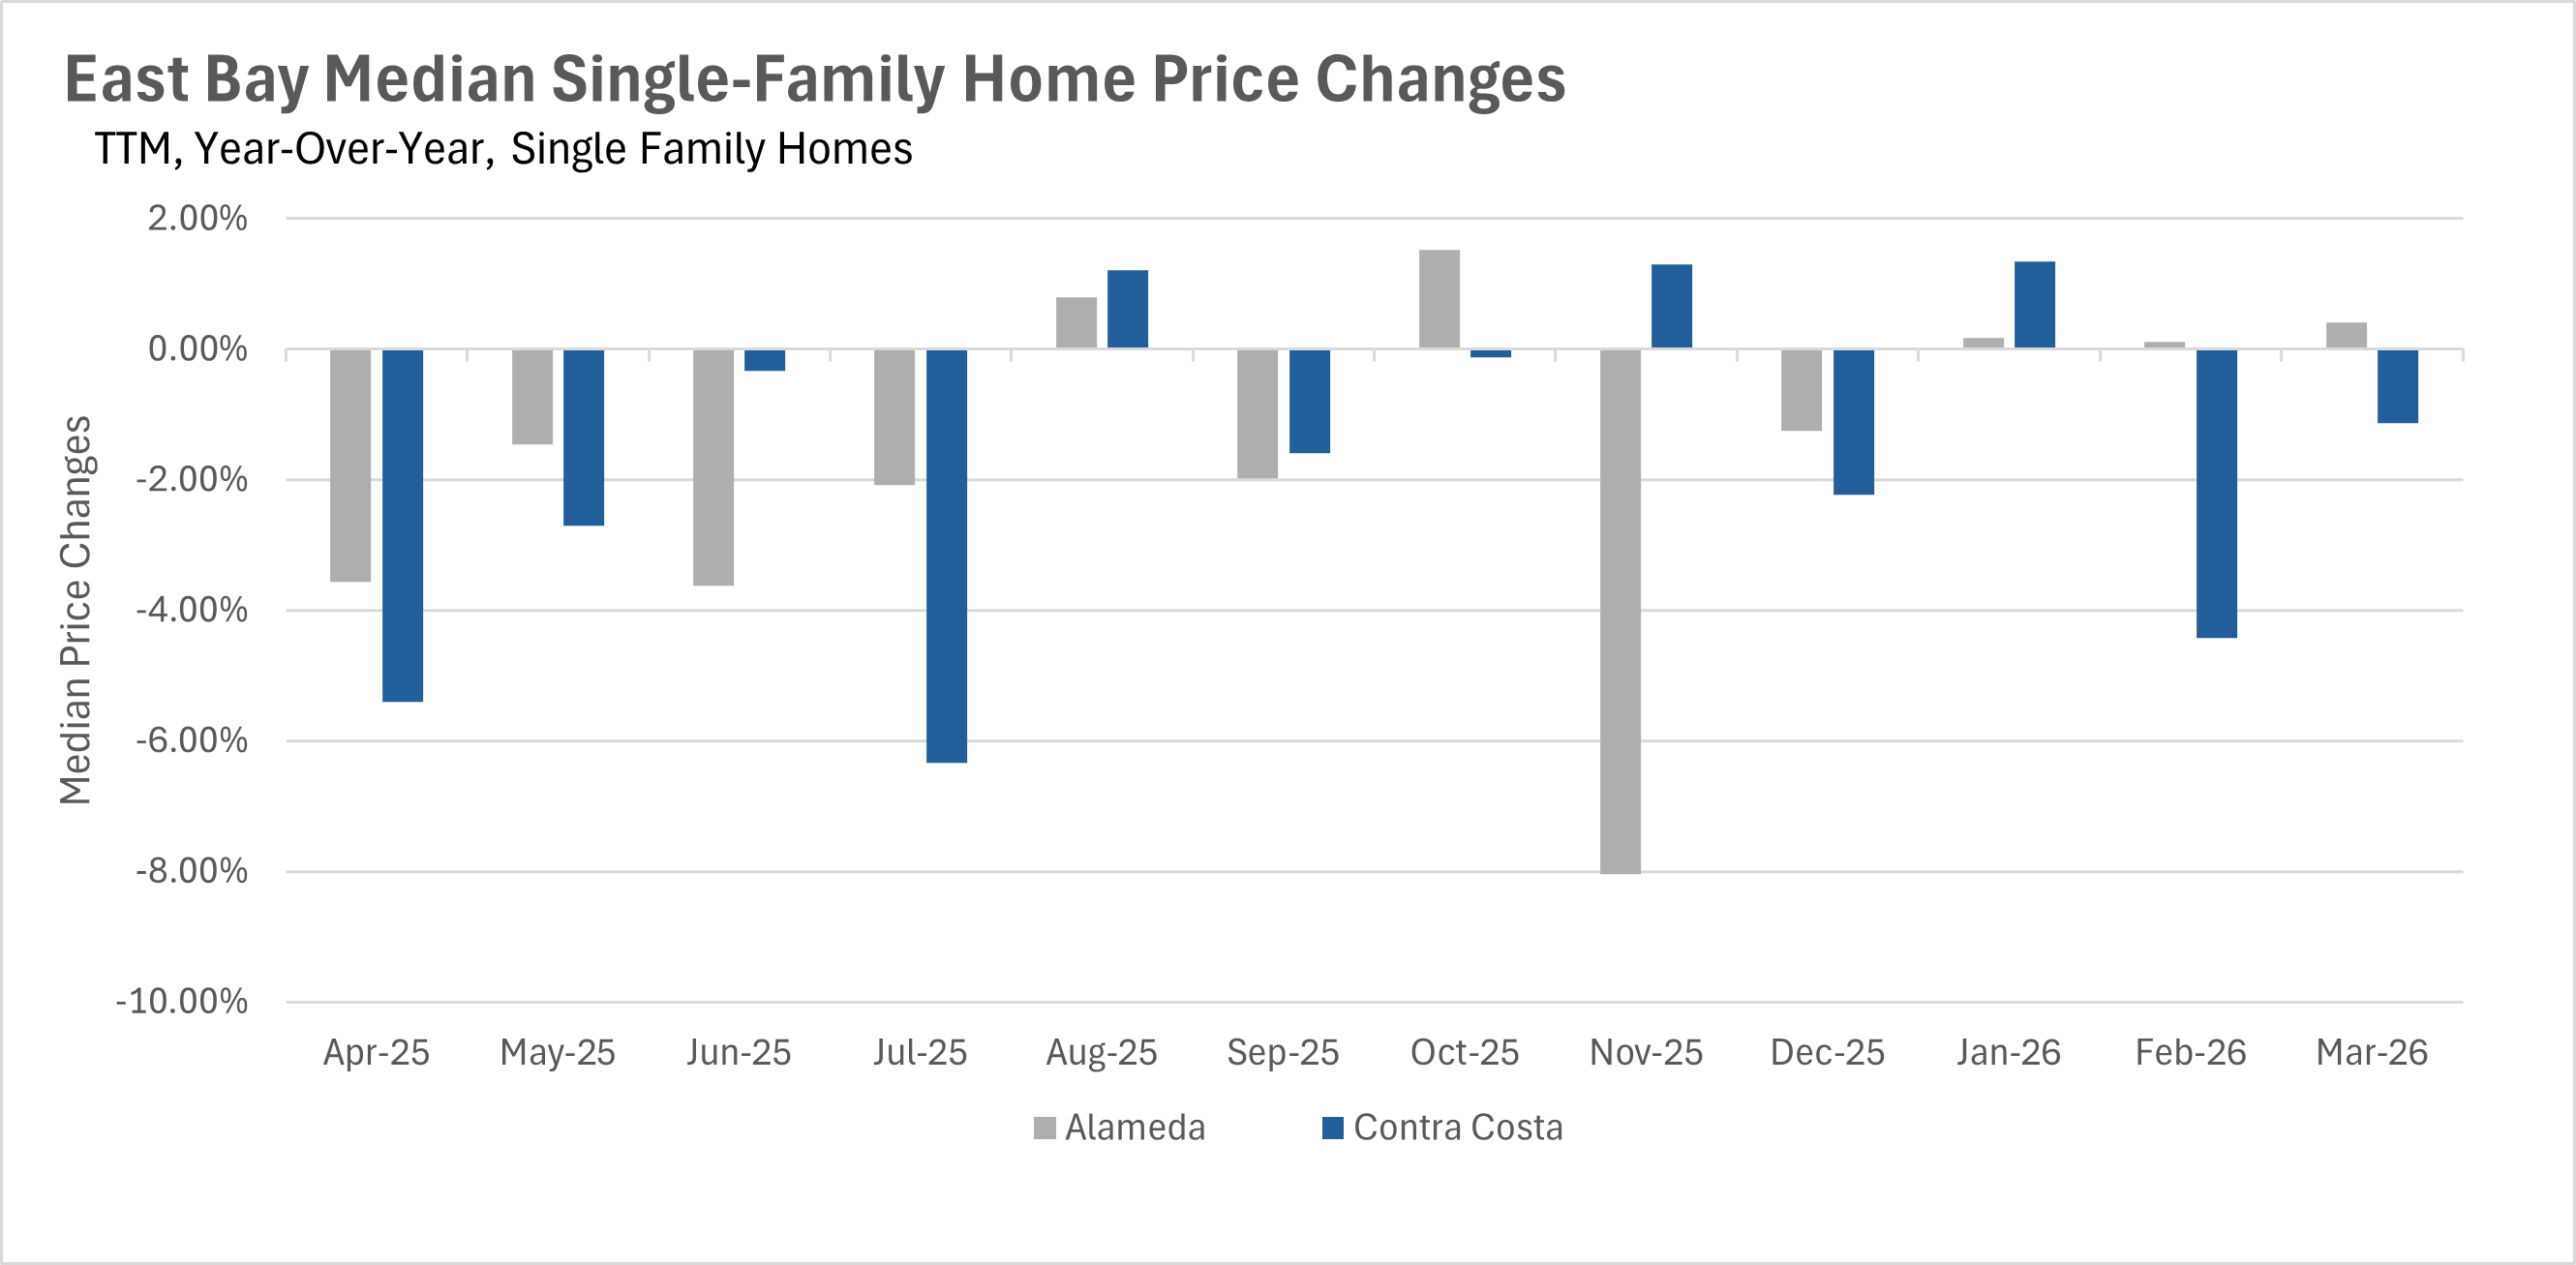
The East Bay single-family market showed real resilience in March. In Alameda County, the median home sold for $1,357,000... just about where it was a year ago, with a slight 0.41% uptick. Contra Costa County came in at $870,000, down a modest 1.14% year-over-year. All things considered, that kind of stability in today's environment is actually a pretty encouraging sign.
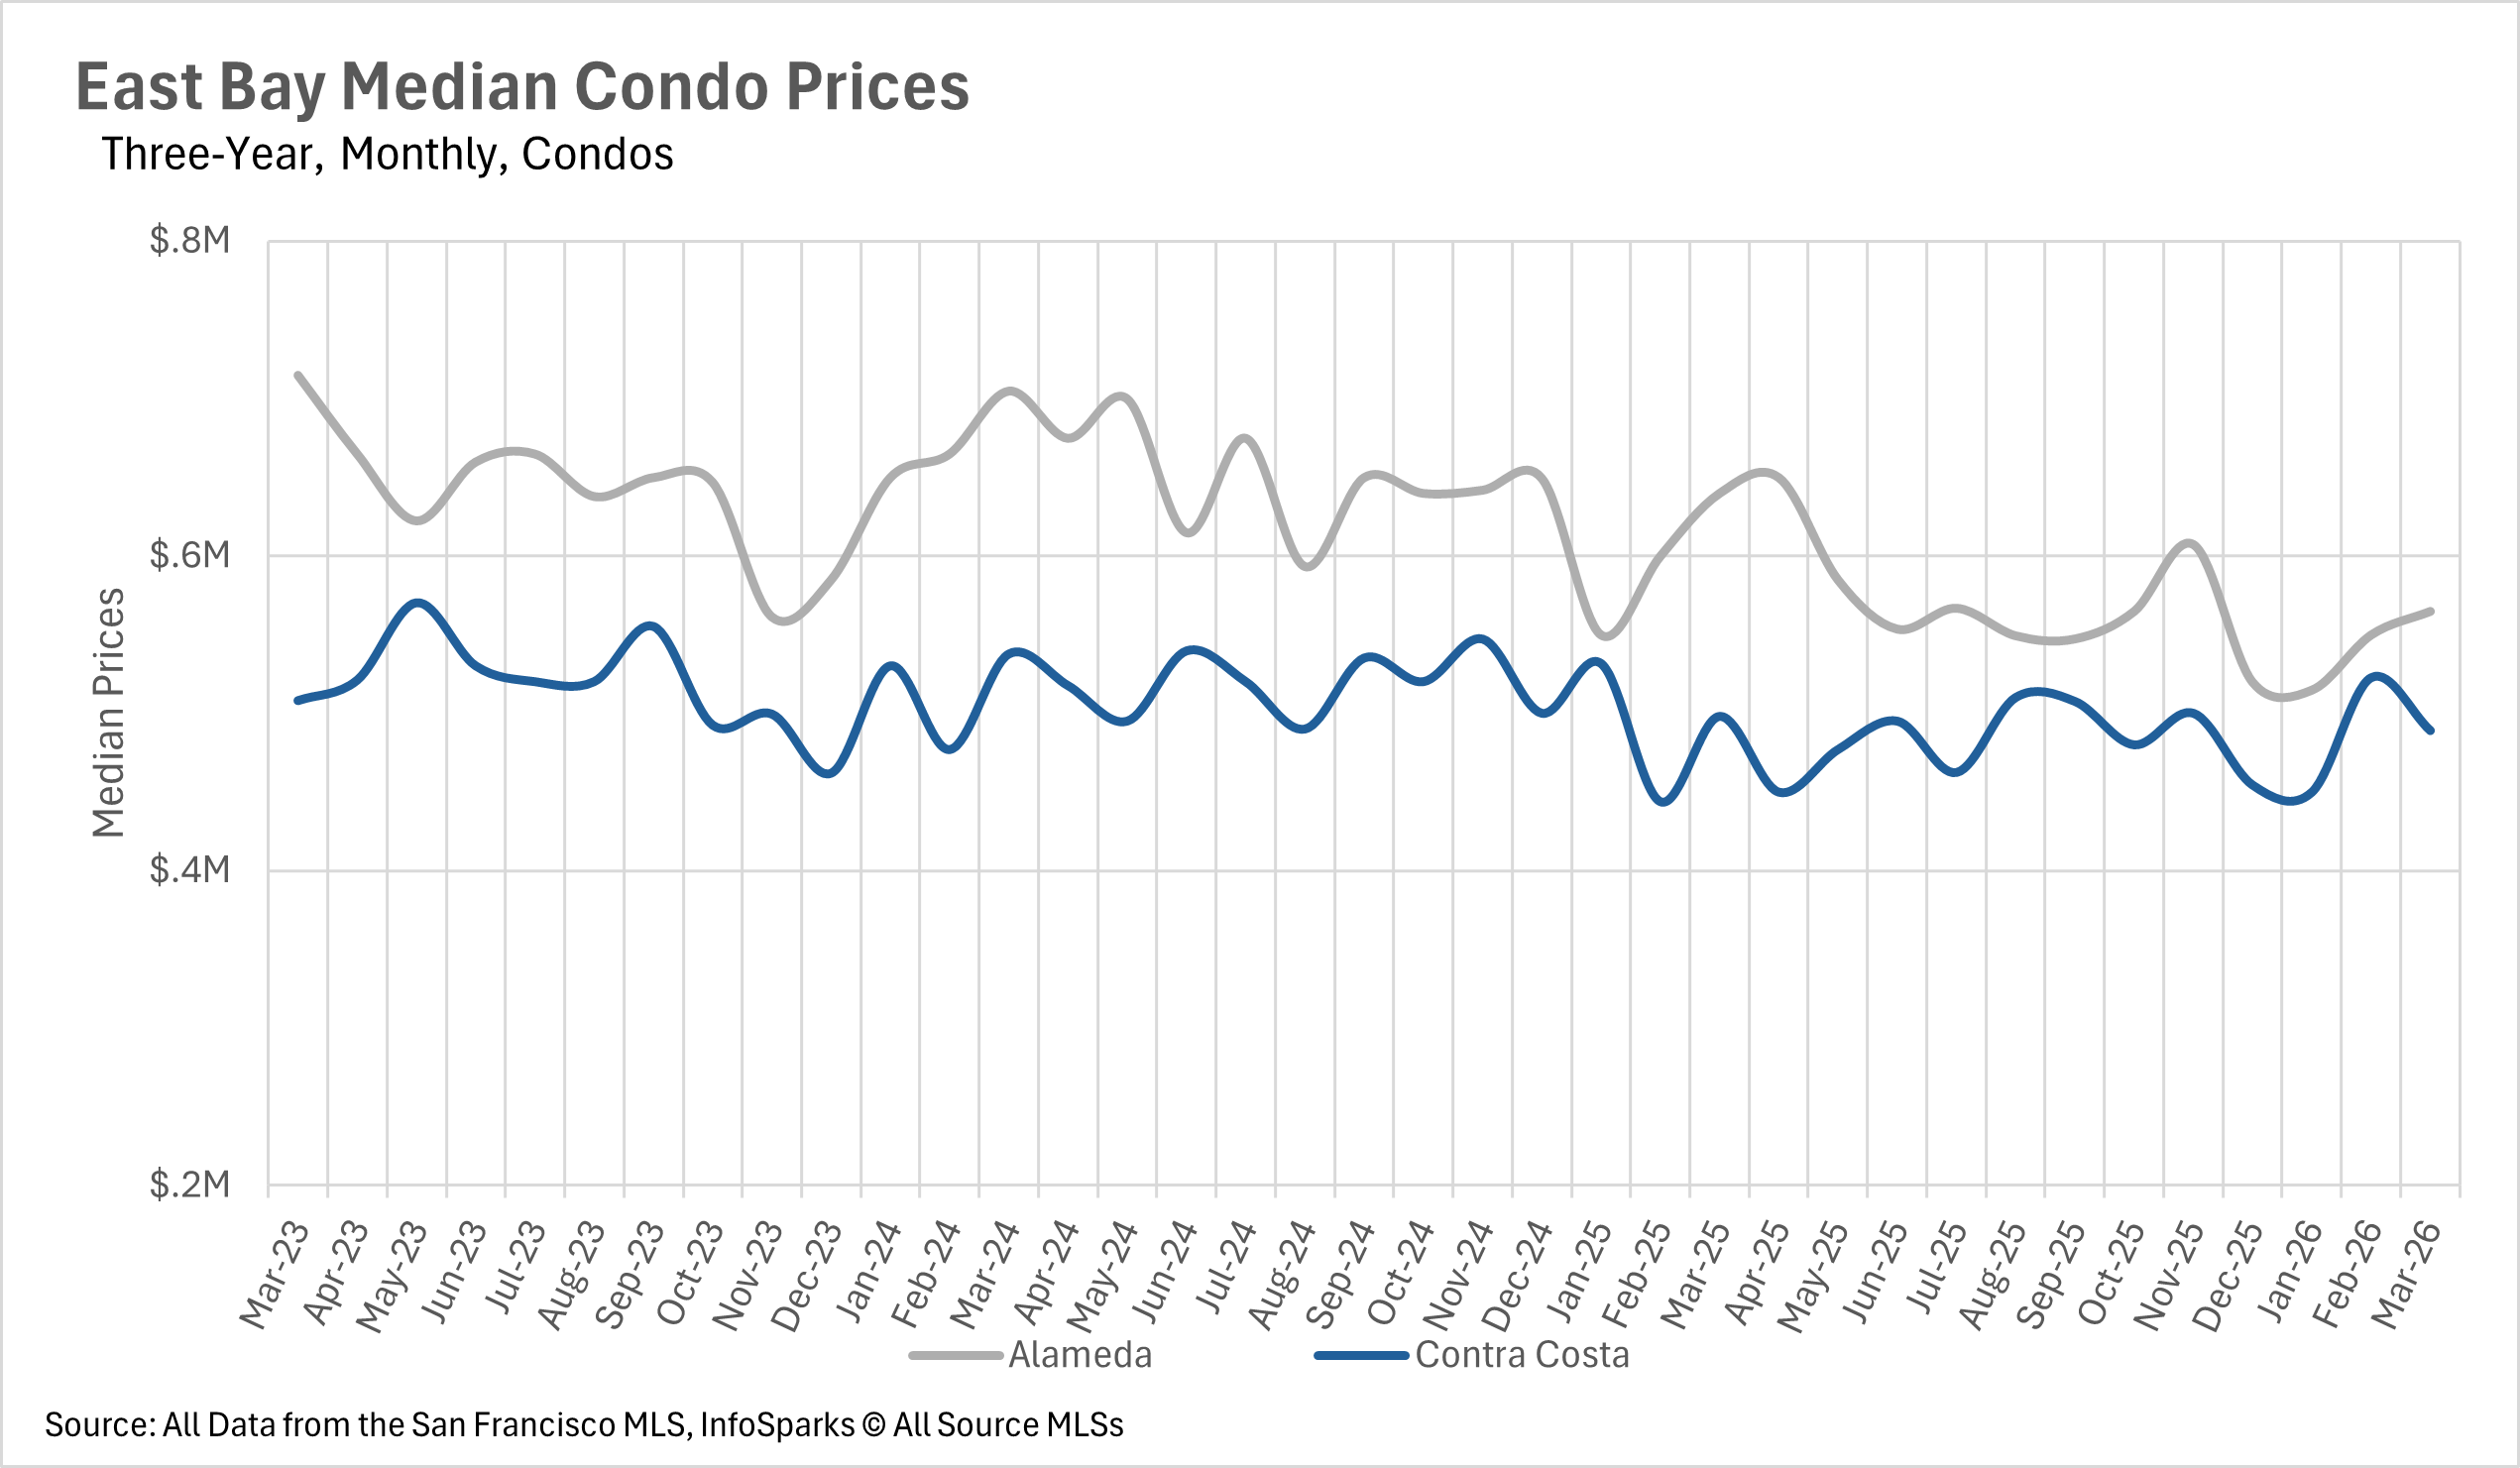
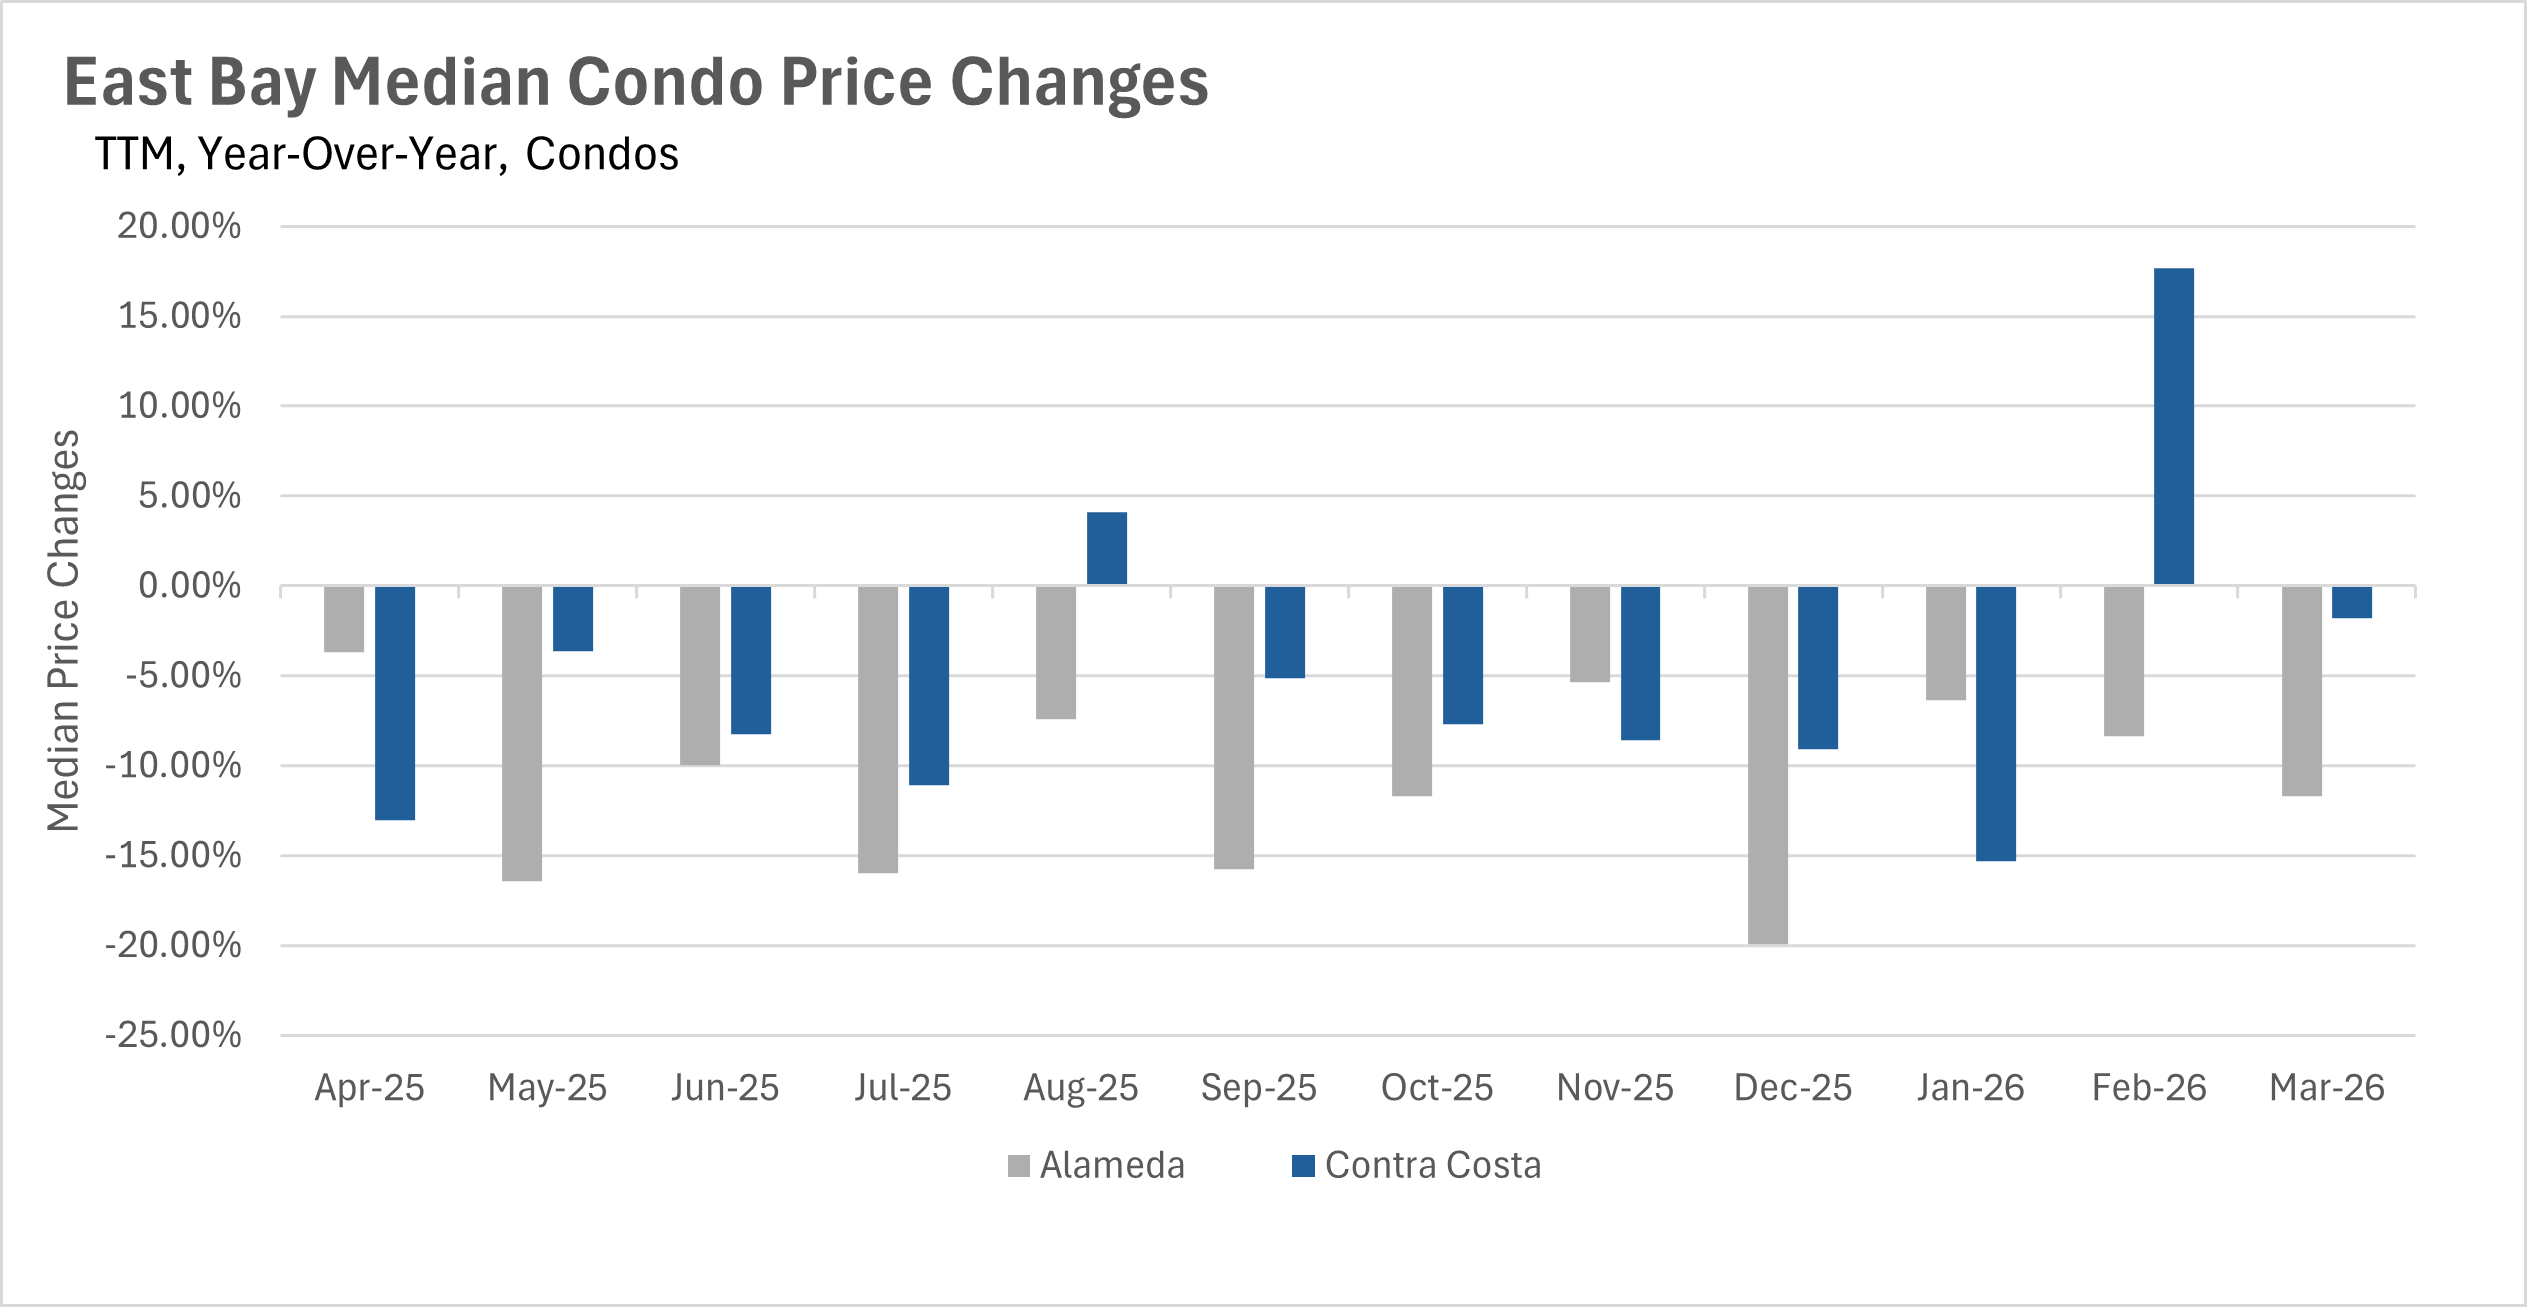
The condo market is a different story. Alameda County condos declined 11.72% year-over-year to a median of $565,000, while Contra Costa County held up a bit better, slipping just 1.81% to $489,000. The gap between what's happening with single-family homes and condos is hard to ignore right now... and it's something worth keeping in mind whether you're buying, selling, or just watching the market.
Inventory remains well below last year as spring arrives
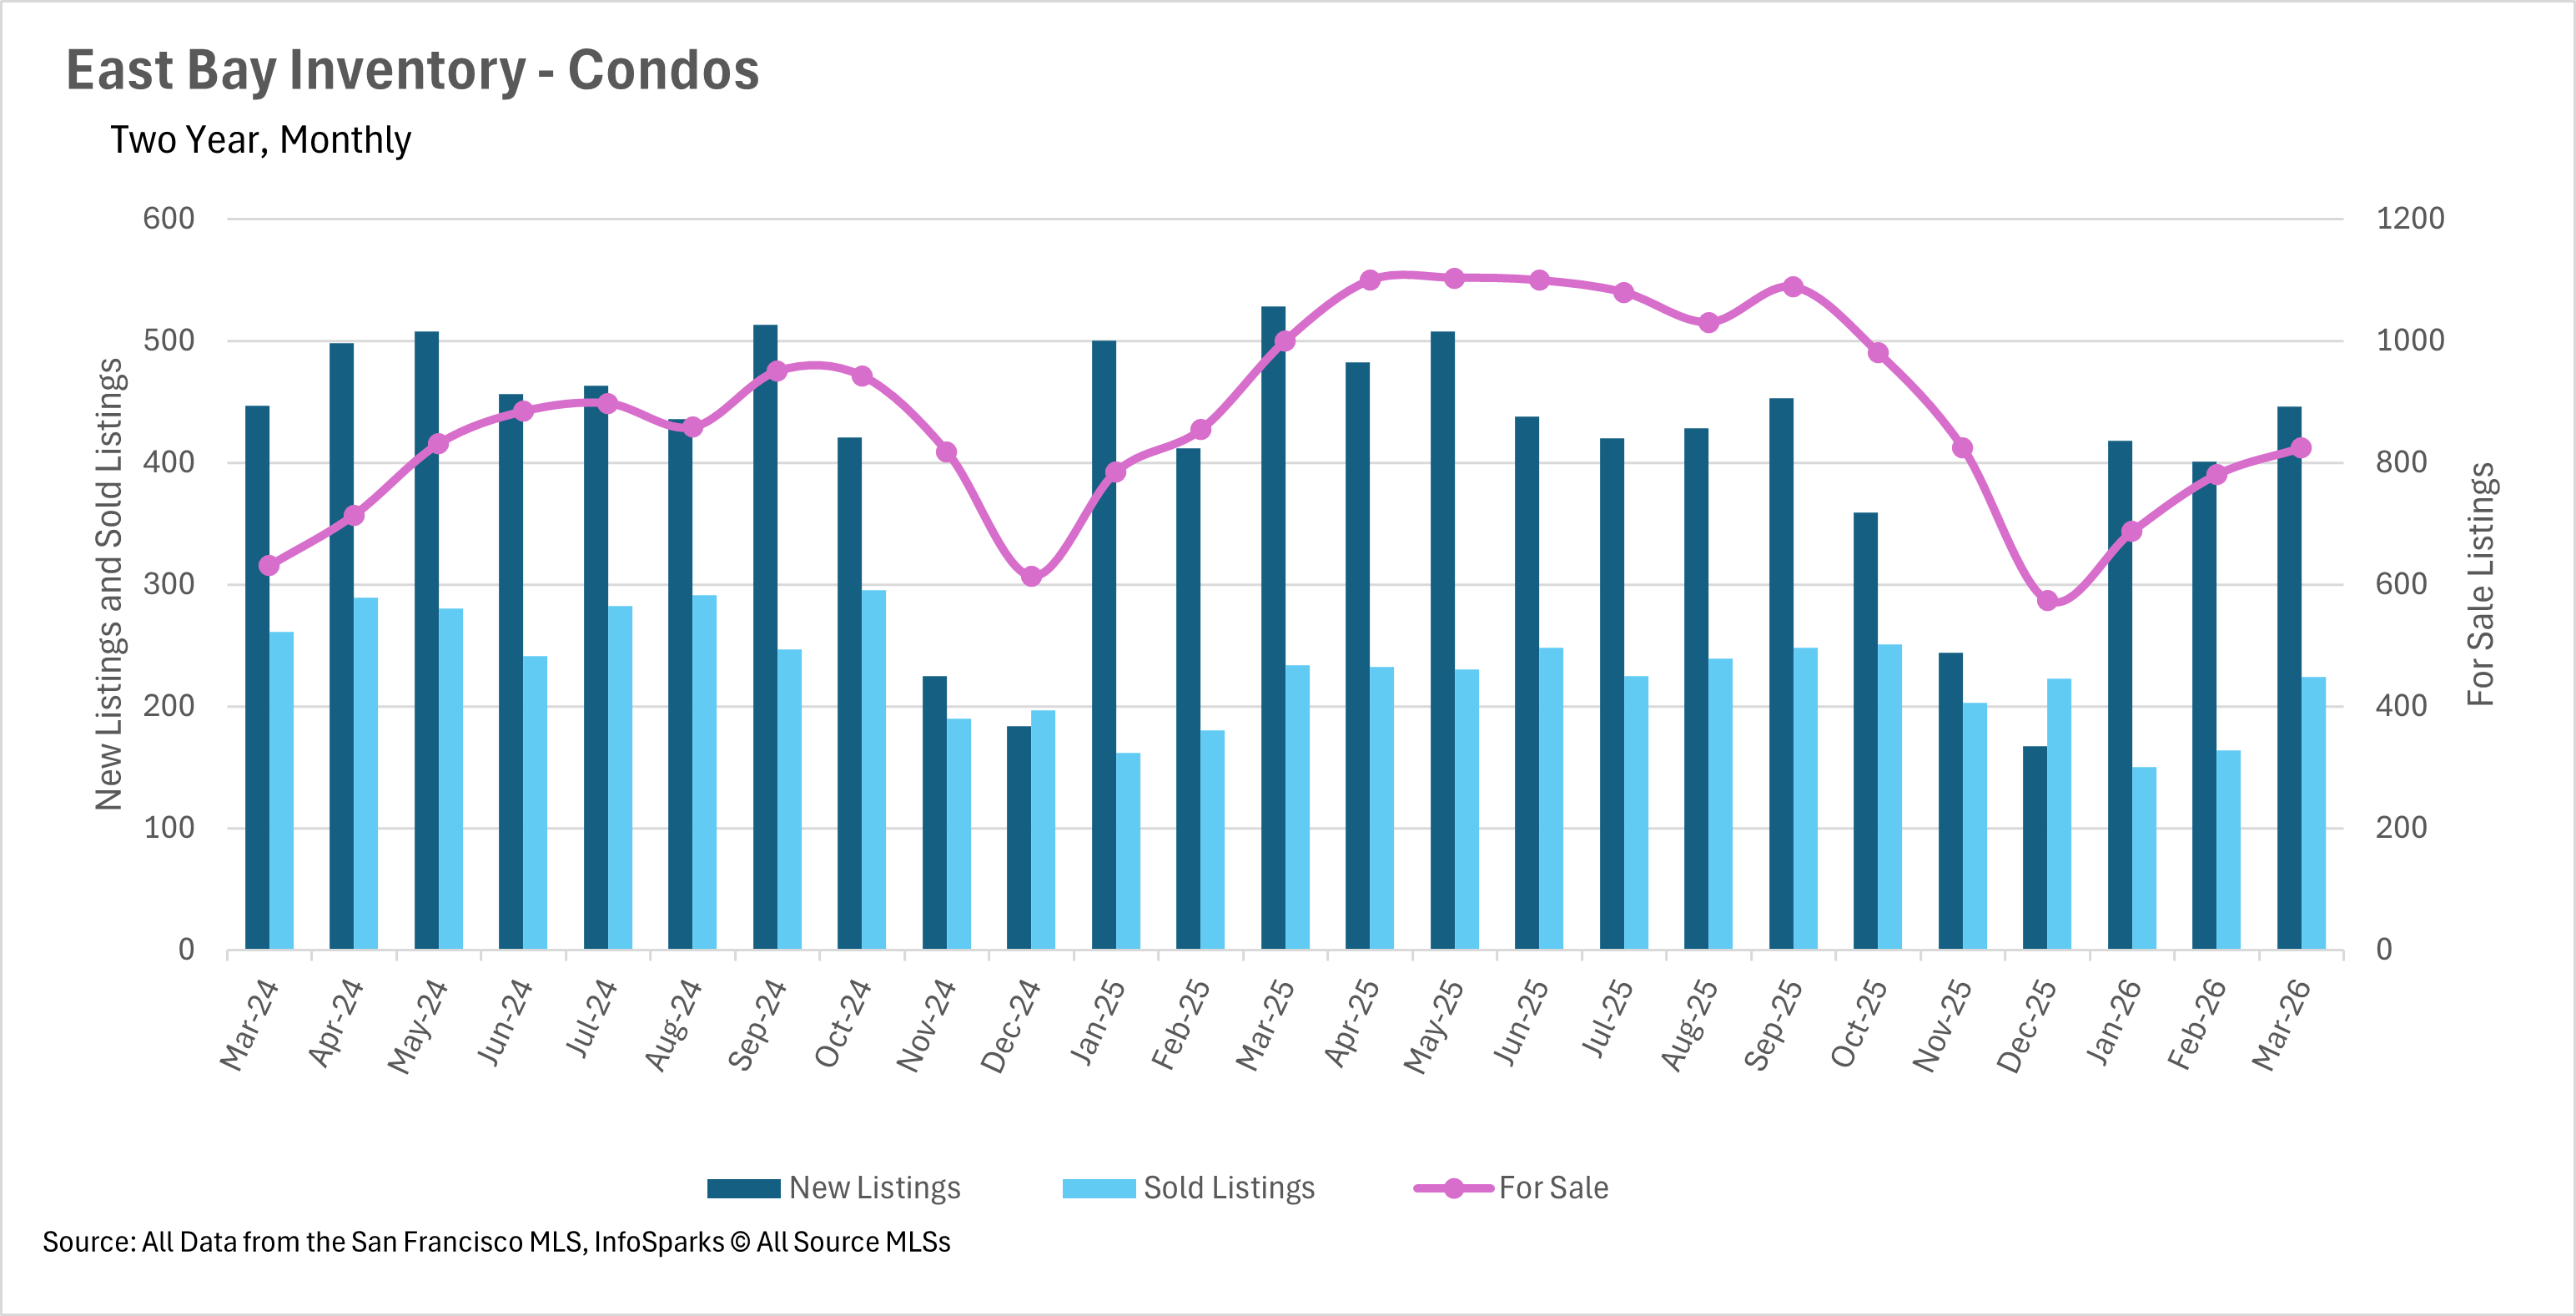
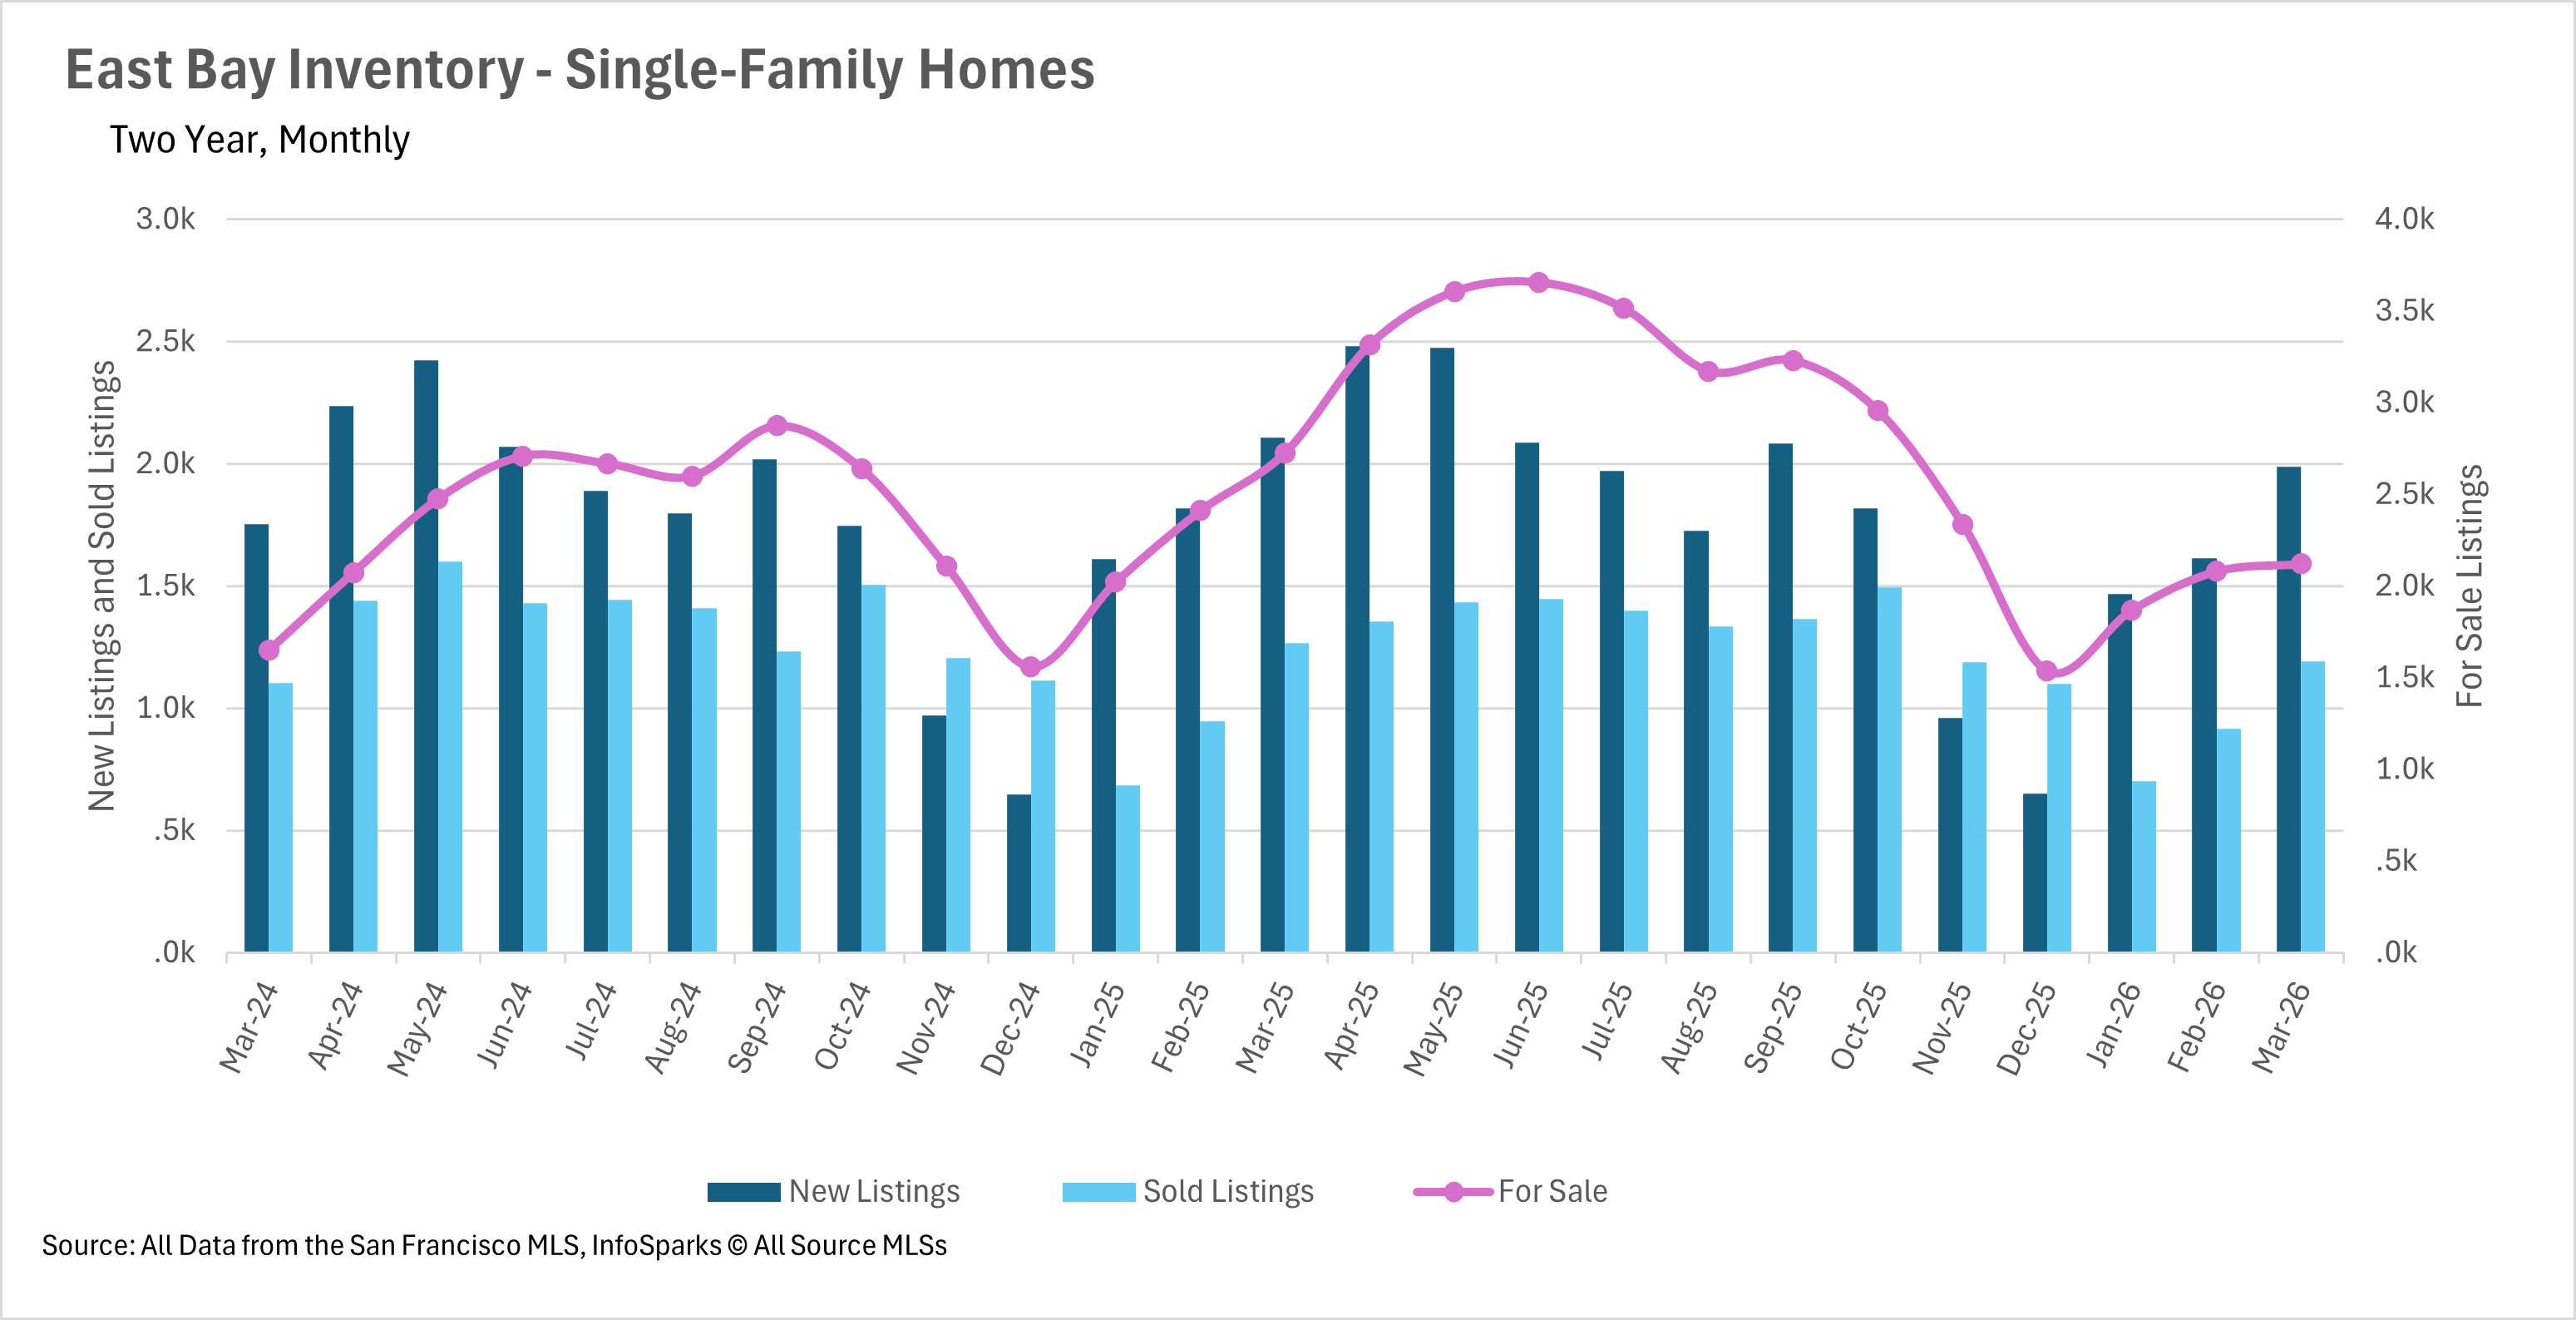
Spring is here, but the inventory picture hasn't loosened up much. Single-family home inventory across the East Bay stood at just 2,120 units in March... down 22.23% compared to this time last year. The condo market saw a similar trend, with inventory down 17.60% to 824 units.
New listings did pick up month-over-month, which is a welcome sign. But the market is absorbing them quickly, keeping overall supply tight. Until we see a more sustained wave of sellers coming to market, buyers are going to continue navigating a competitive landscape... especially on the single-family side.
Single-family homes are moving at a blistering pace
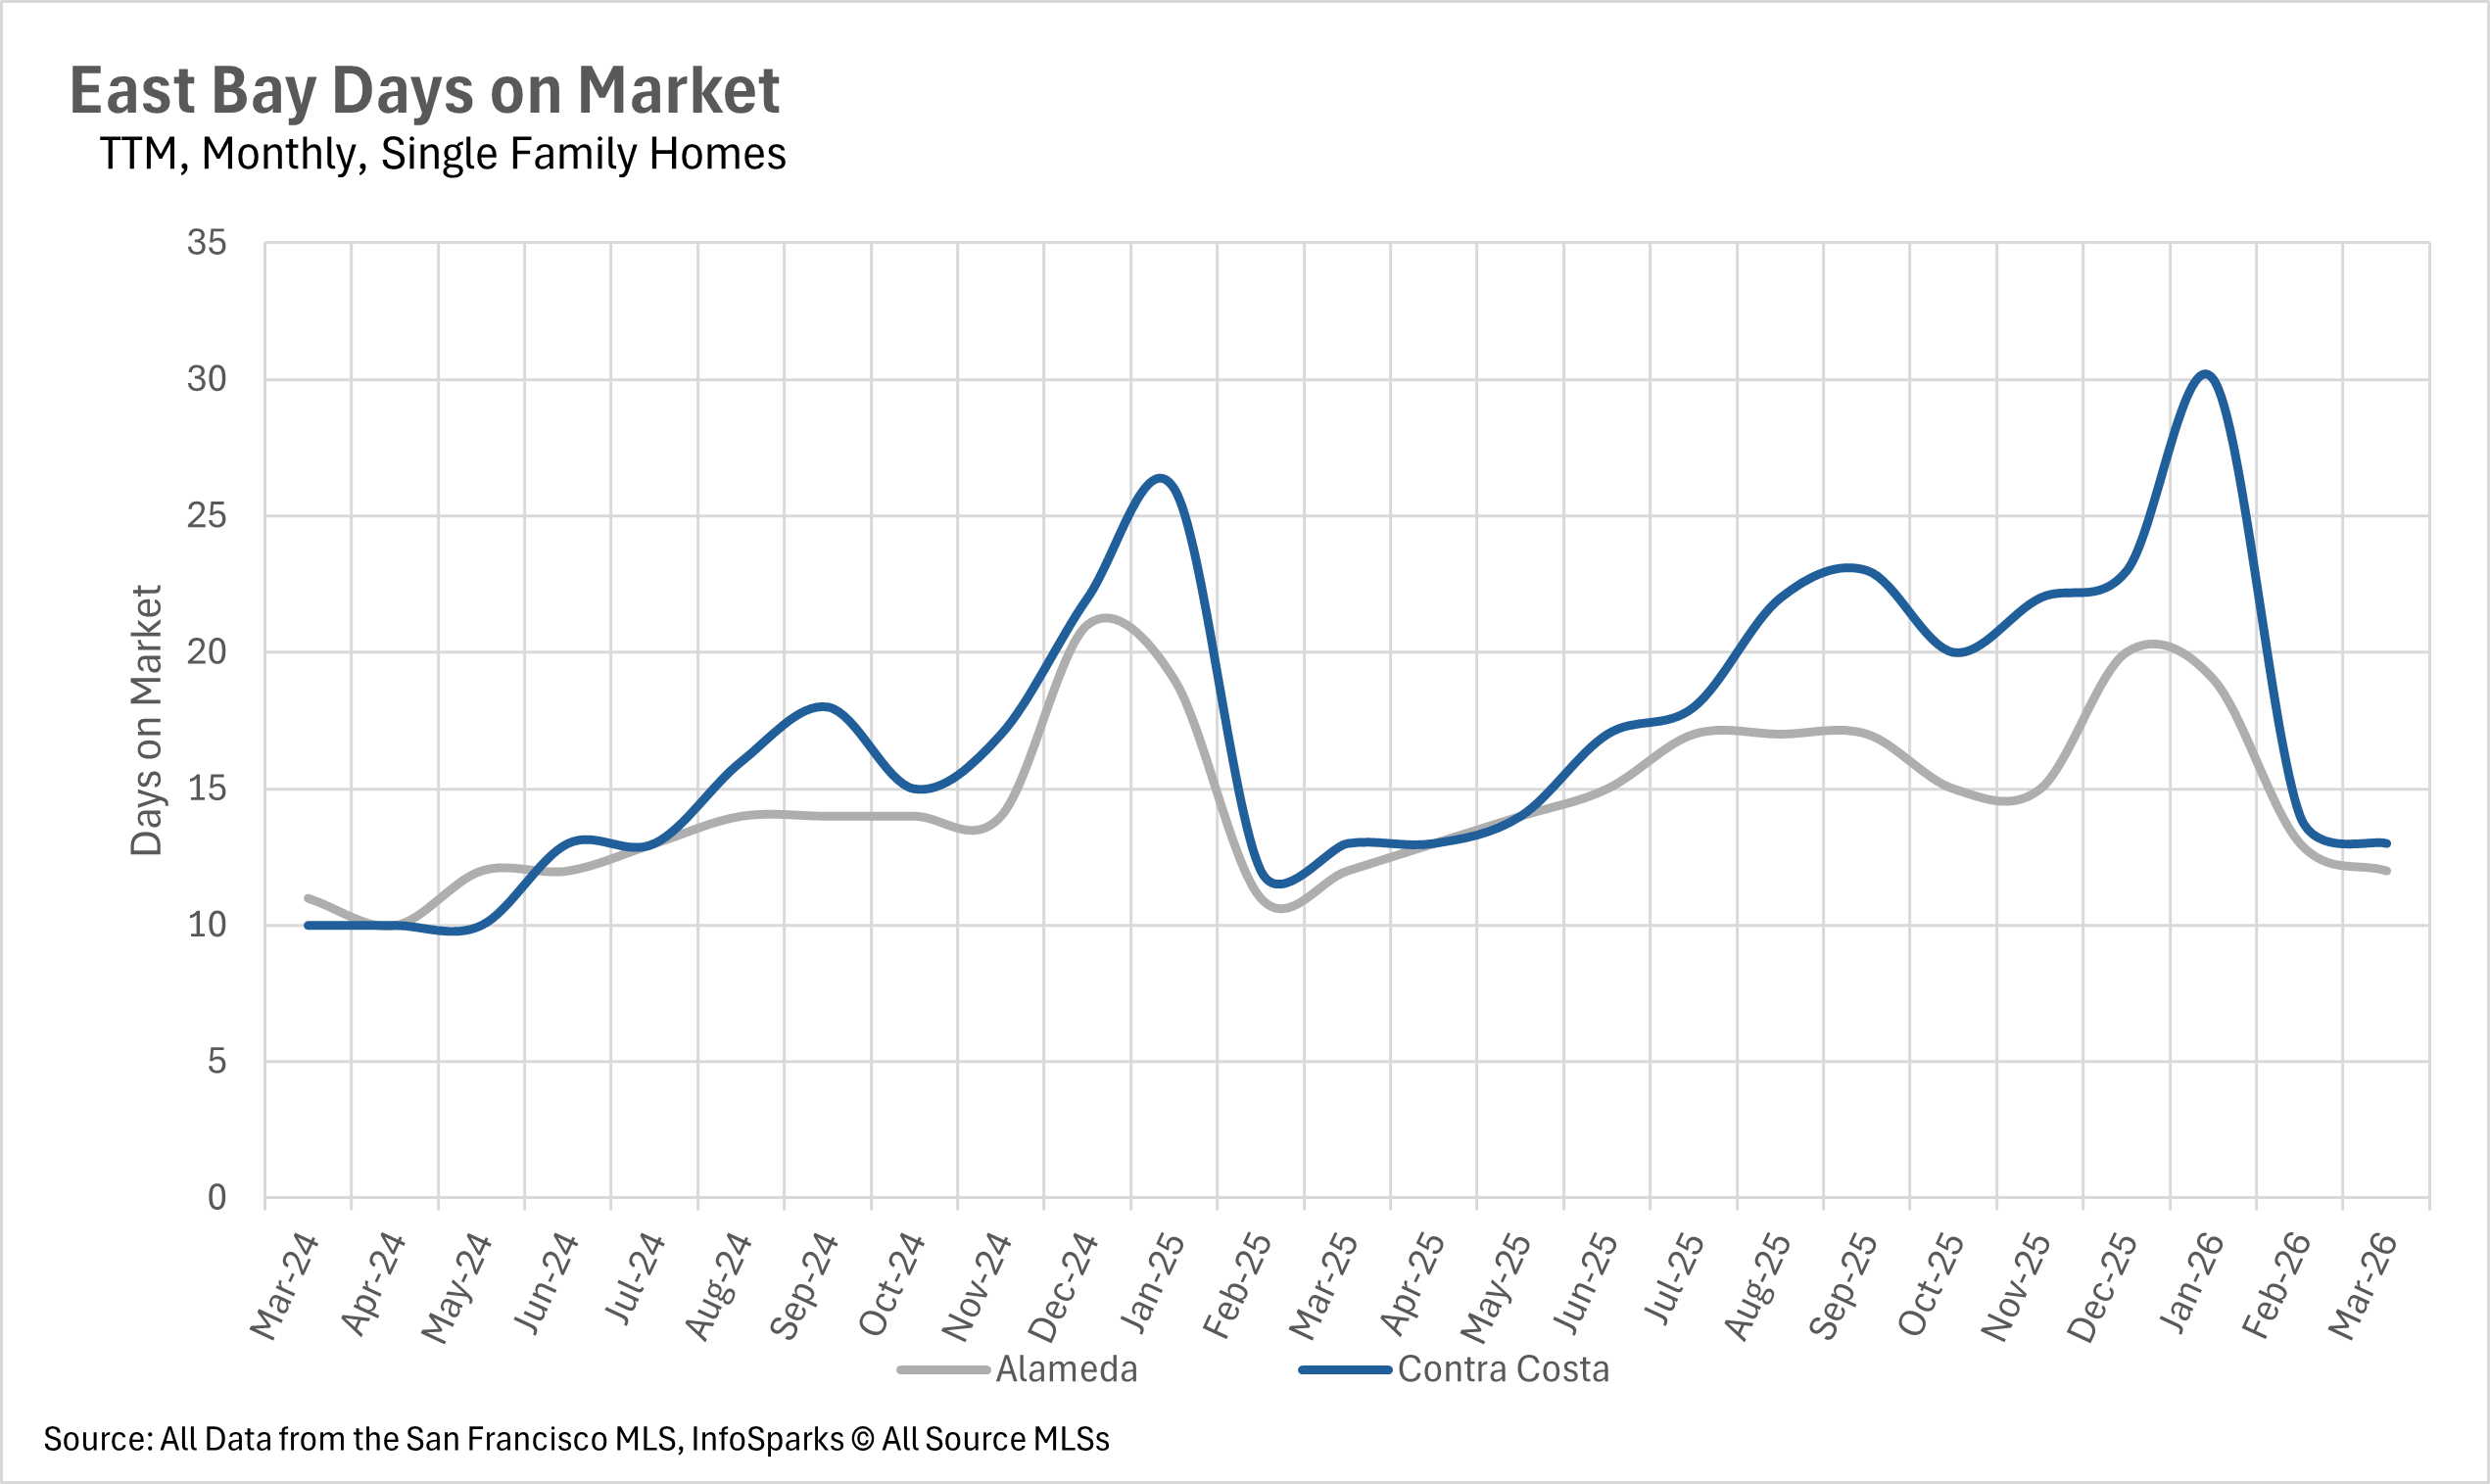
Buyer demand in the East Bay isn't showing any signs of letting up. The average single-family home in Alameda County sold in just 12 days, while Contra Costa County came in at 13 days... both essentially unchanged from a year ago. The fact that homes are still moving this fast despite elevated interest rates says a lot about how motivated buyers in this market really are.
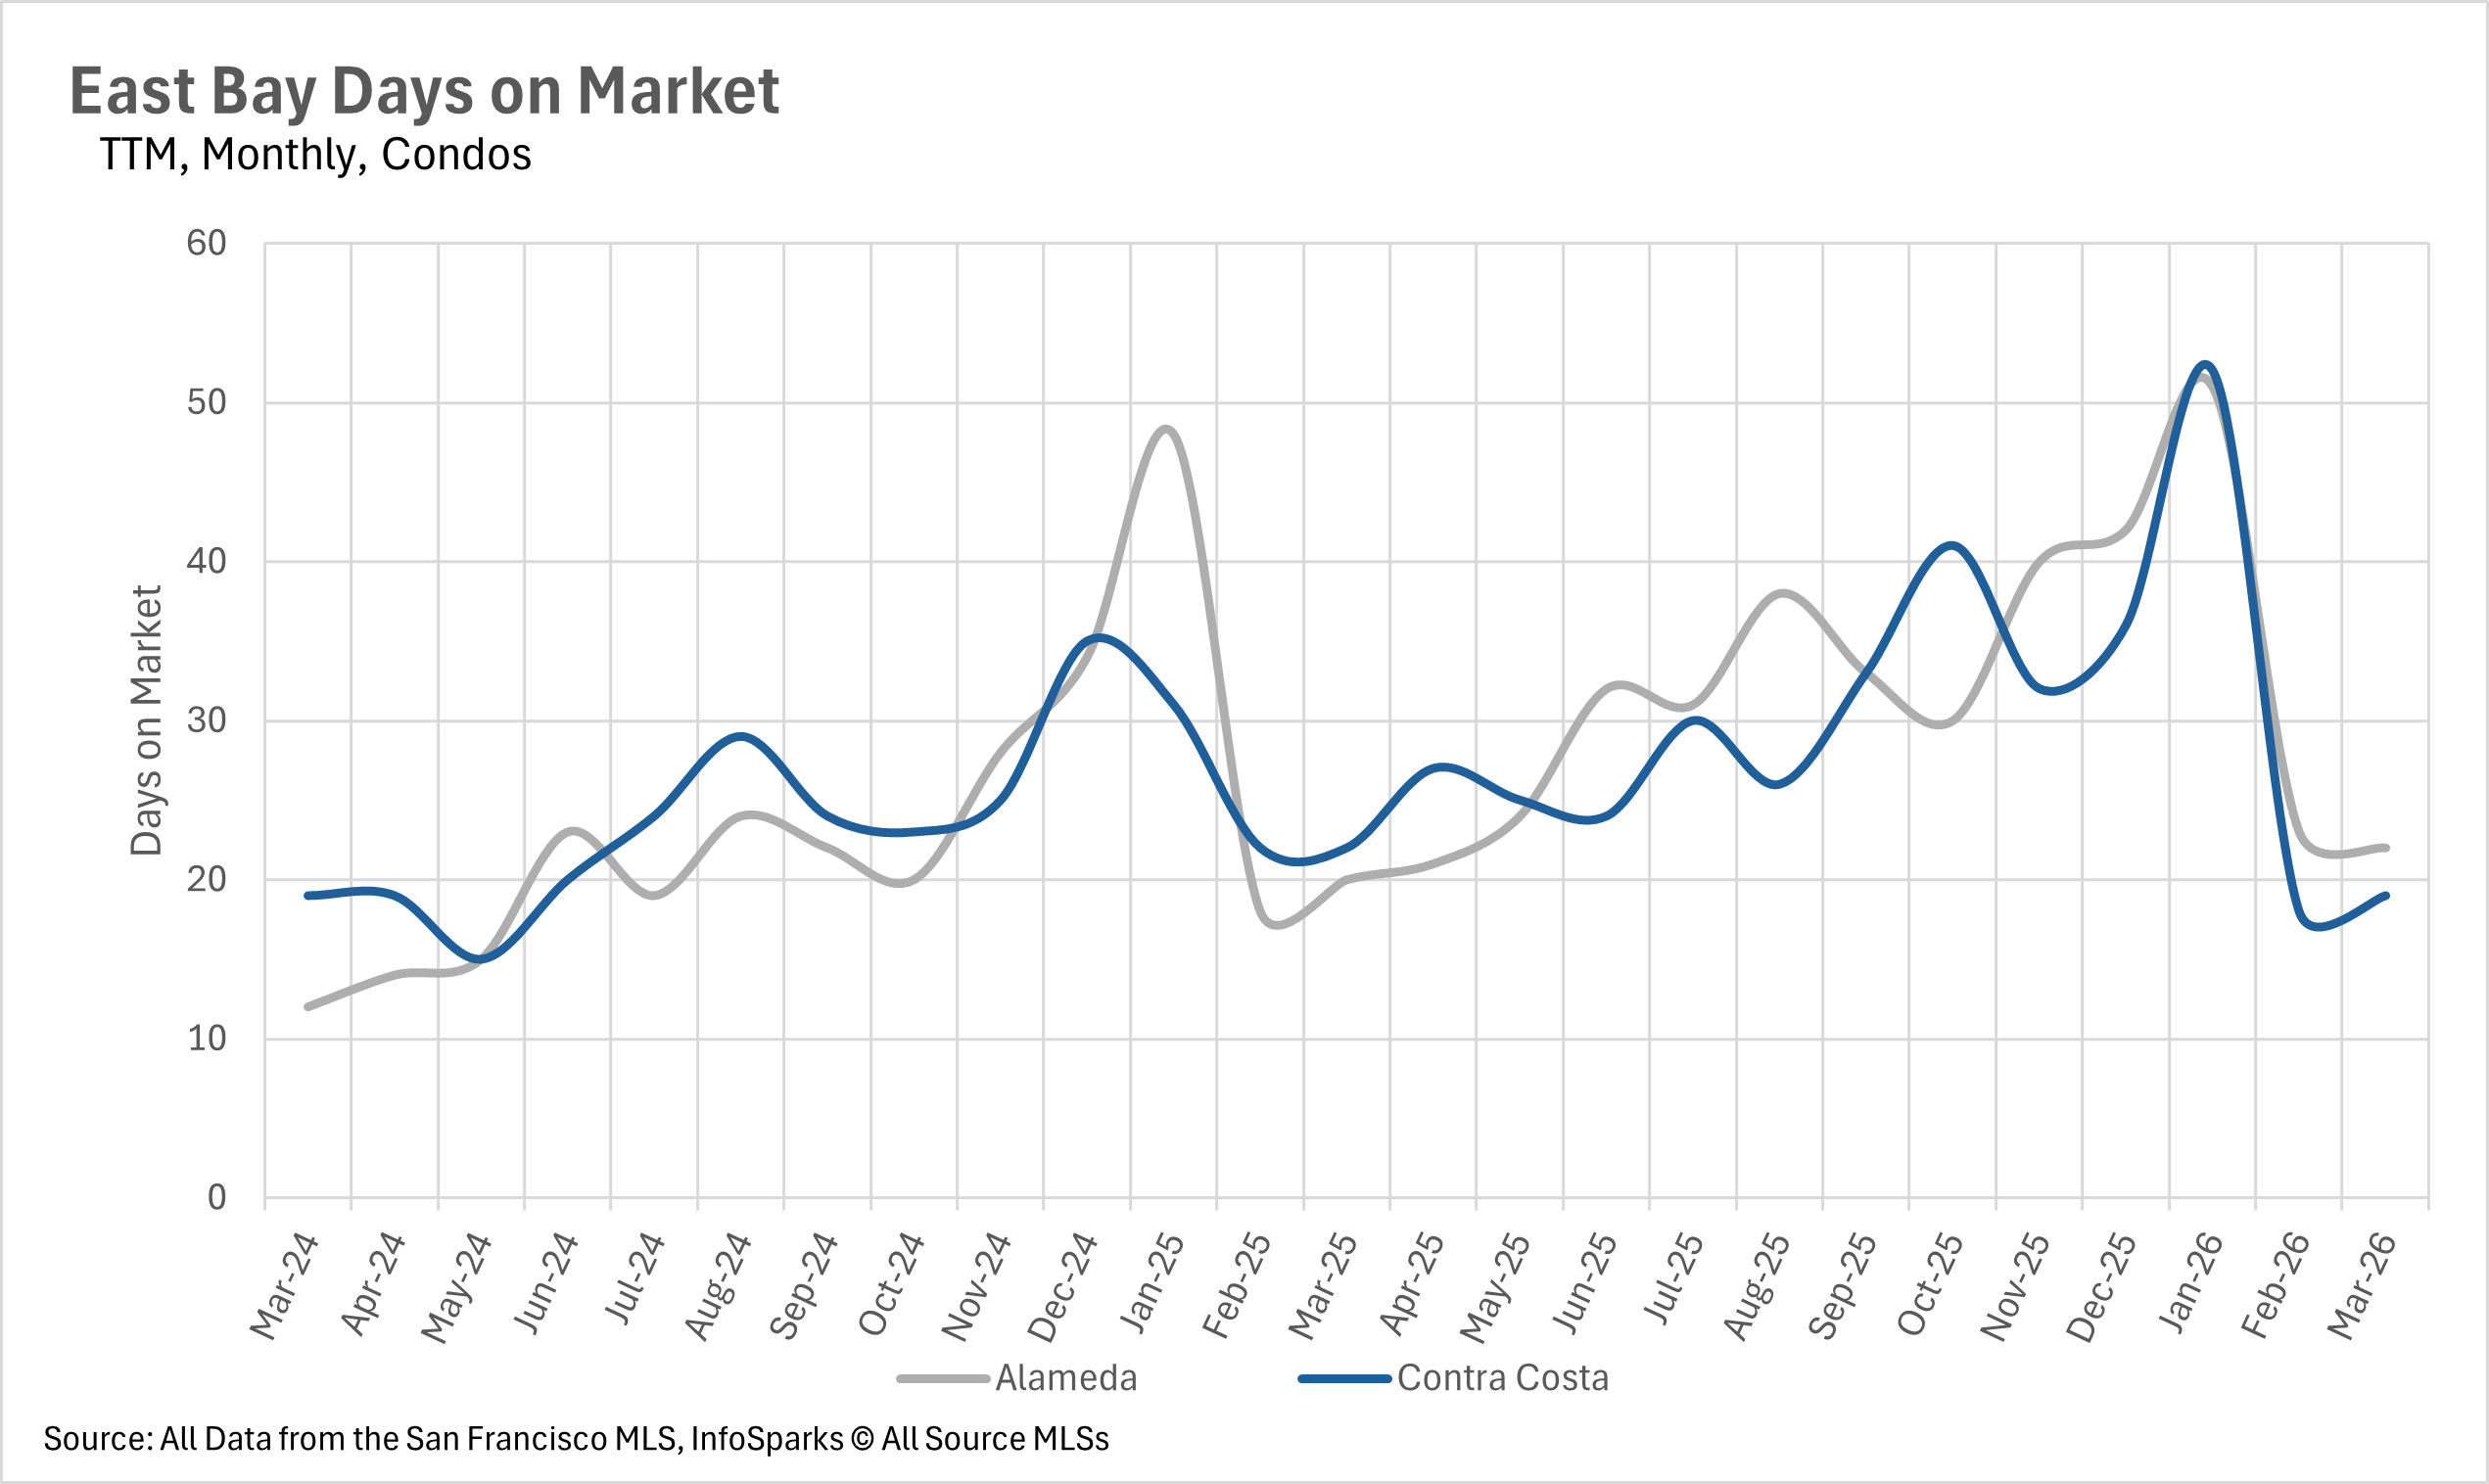
Condos are taking a little longer, with Alameda County averaging 22 days and Contra Costa County coming in at 19 days. But even those numbers are reasonable by historical standards... it's less about condos being hard to sell and more about single-family homes moving at an exceptional pace right now.
The tale of two markets continues in the East Bay
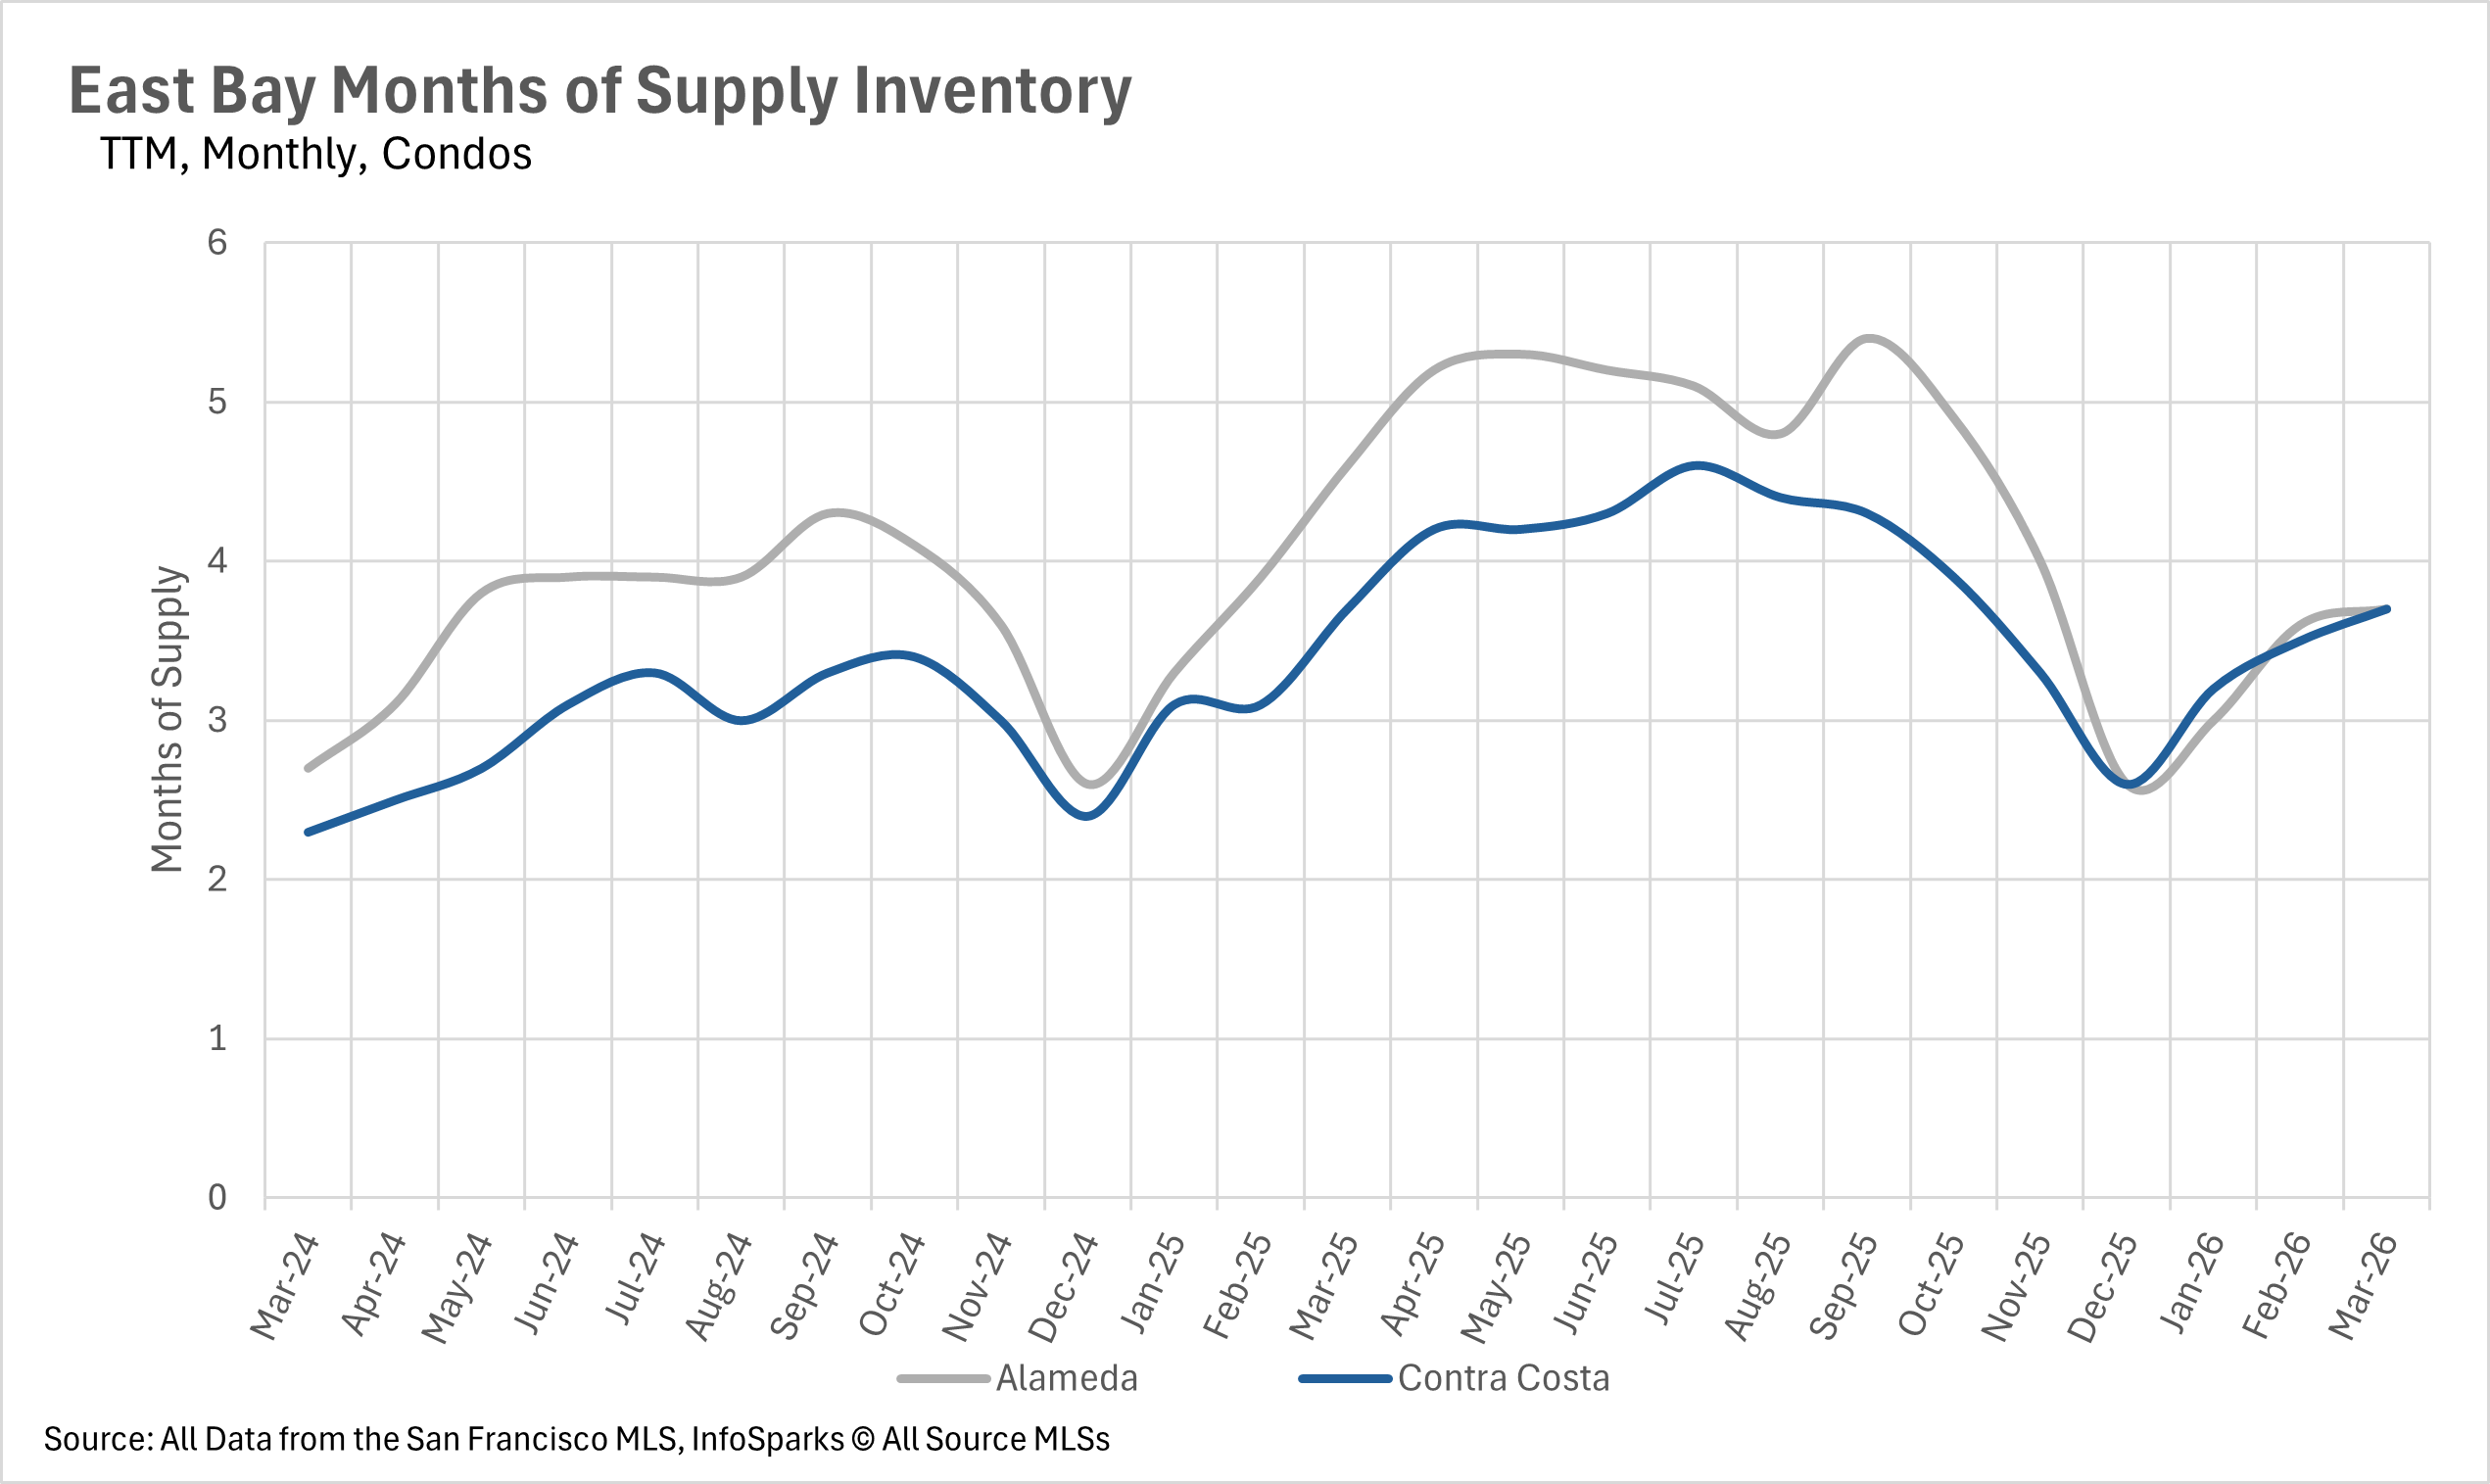
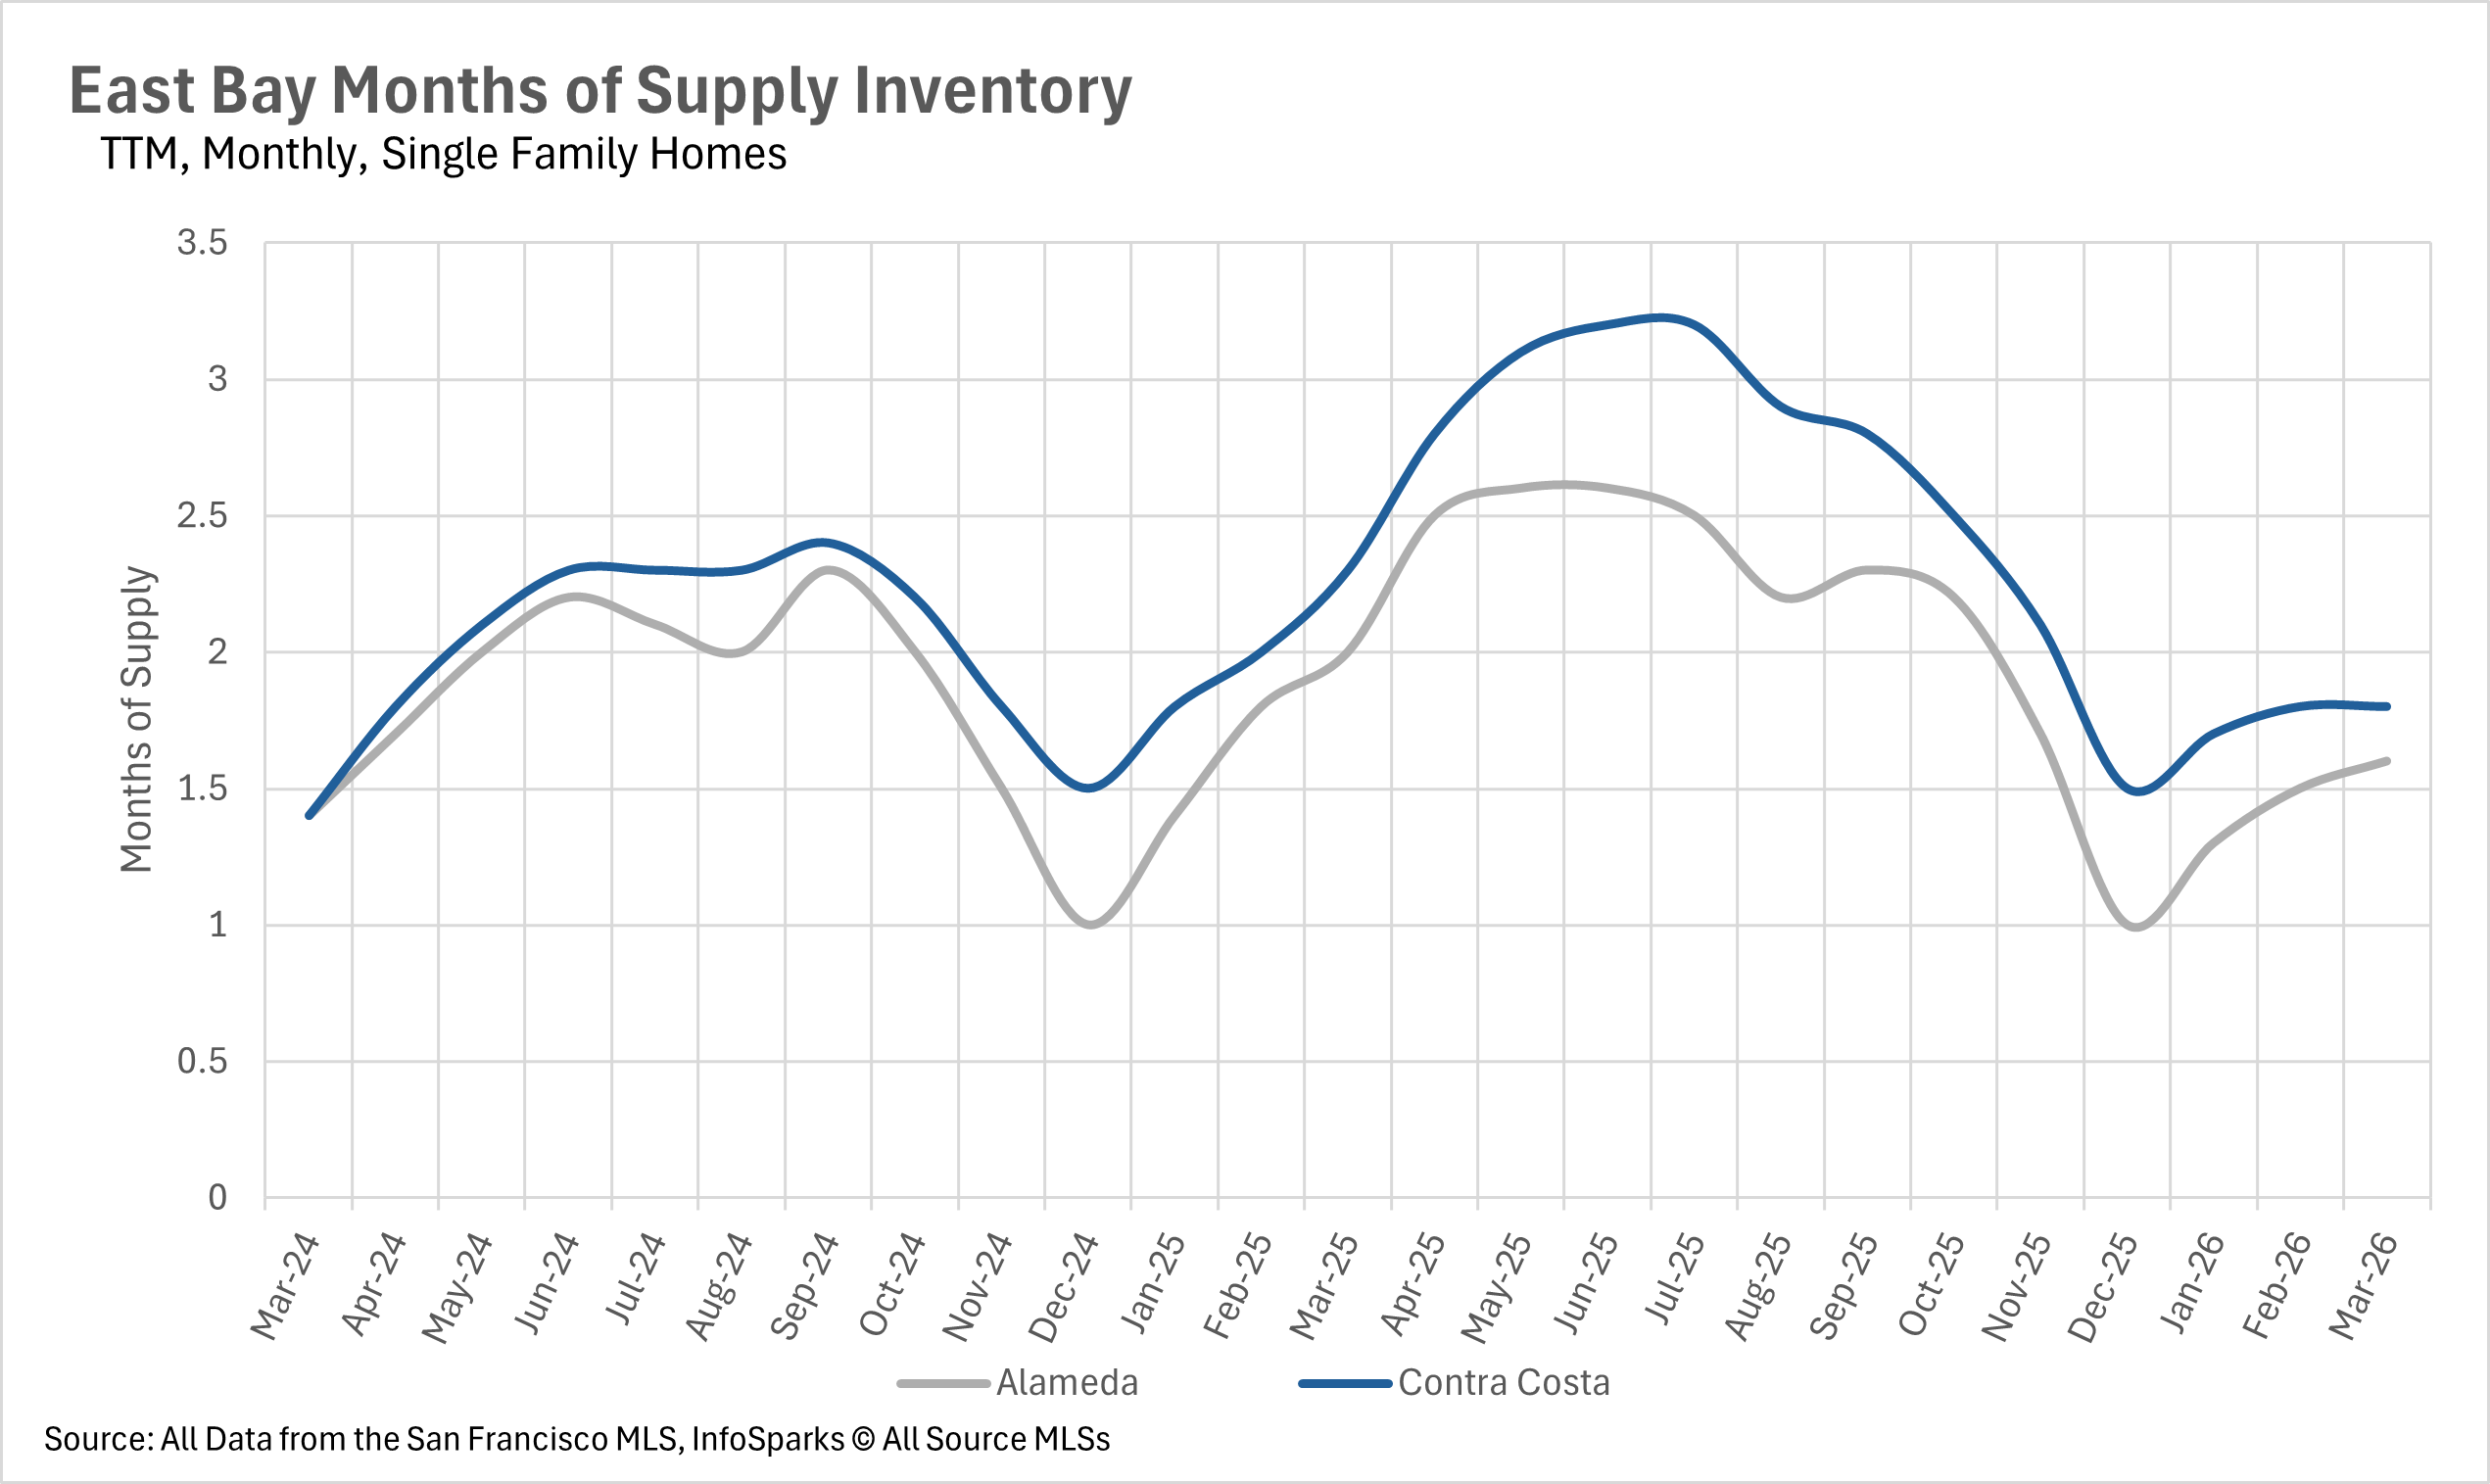
One of the clearest ways to read a market is through Months of Supply Inventory, or MSI. California historically averages around three months... which is considered balanced. Below three months favors sellers. Above three months shifts the advantage toward buyers.
Right now, the East Bay is really living up to that "tale of two markets" story. Single-family homes remain in strong seller's territory... Alameda County sits at just 1.6 months of supply and Contra Costa County at 1.8 months, both down more than 20% year-over-year. Competition among single-family buyers is fierce, and that's not changing anytime soon with inventory this low.
The condo market is a completely different conversation. Both Alameda and Contra Costa Counties ended March at 3.7 months of condo inventory... firmly in buyer's market territory. If you're considering a condo purchase in the East Bay, you actually have more negotiating room than you might expect right now. It's one of the few areas of this market where buyers have a real advantage.
Bottom Line
The East Bay market this spring is really being defined by one clear divide... single-family homes versus condos. Single-family inventory is tight, demand is strong, and homes are selling in under two weeks. That's a seller's market by any measure. On the condo side, softening prices and higher supply are giving buyers more breathing room and more room to negotiate. What ties it all together is that this market rewards preparation. If you're buying a single-family home, being ready to move quickly matters. If you're looking at condos, take your time and use the leverage you have. And if you're selling... pricing and presentation are still your most powerful tools, no matter what segment you're in.
Stay up to date on the latest real estate trends.

Newsletter

Newsletter
A Smart, Stress-Free Plan

Newsletter

Newsletter

Newsletter

Newsletter

Newsletter

Newsletter

Newsletter
You’ve got questions and we can’t wait to answer them.